Oreilly high performance mysql 2rd edition
Architecture
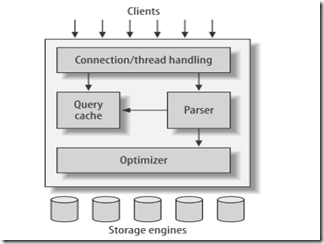
MySQL’s most unusual and important feature is its storage-engine architecture, whose design separates query processing and other server tasks from data storage and retrieval.
This separation of concerns lets you choose, on a per-table basis, how your data is stored and what performance, features, and other characteristics you want.

Mysql的一個最顯著的特征就是其存儲引擎架構,這樣不僅僅可以底層的數據存取從server中剝離,同時可以做到同一個數據庫不同表采用不同的底層數據存儲格式,以滿足不同的性能以及應用的要求。
The optimizer does not really care what storage engine a particular table uses, but the storage engine does affect how the server optimizes query. The optimizer asks the storage engine about some of its capabilities and the cost of certain operations, and for statistics on the table data.
Mysql 對transaction的支持
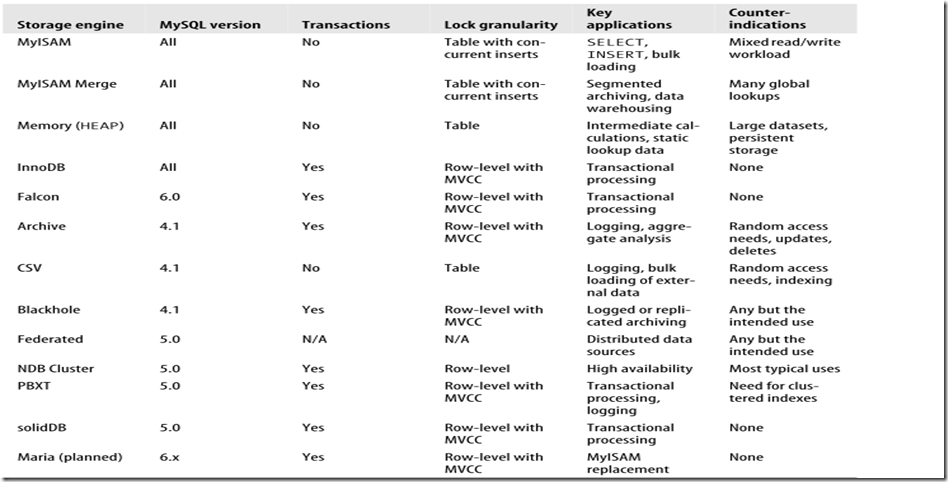
MySQL AB provides three transactional storage engines: InnoDB, NDB Cluster, and Falcon.
MySQL doesn’t manage transactions at the server level. Instead, the underlying storage engines implement transactions themselves. This means you can’t reliably mix different engines in a single transaction. MySQL AB is working on adding a higher level transaction management service to the server, which will make it safe to mix and match transactional tables in a transaction.
因為目前mysql是在storage engine層實現事務的支持,所以在一個事務中操作多個不同engine的表是不可靠的,要實現這個功能需要上層的server的支持。
Implicit and explicit locking
InnoDB uses a two-phase locking protocol. It can acquire locks at any time during a transaction, but it does not release them until a COMMIT or ROLLBACK. It releases all the locks at the same time. The locking mechanisms described earlier are all implicit. InnoDB handles locks automatically, according to your isolation level.
However, InnoDB also supports explicit locking, which the SQL standard does not
mention at all:
? SELECT ... LOCK IN SHARE MODE
? SELECT ... FOR UPDATE
MySQL’s Storage Engines

Storage Engine Considerations
Here are the main elements you should take into account:
- Transactions
If your application requires transactions, InnoDB is the most stable, well integrated, proven choice.
MyISAM is a good choice if a task doesn’t require transactions and issues primarily either SELECT or INSERT queries. Sometimes specific components of an application (such as logging) fall into this category.
- Concurrency
How best to satisfy your concurrency requirements depends on your workload.If you just need to insert and read concurrently, believe it or not, MyISAM is a fine choice! If you need to allow a mixture of operations to run concurrently without interfering with each other, one of the engines with row-level locking should work well.
- Backups
The need to perform regular backups may also influence your table choices. If your server can be shut down at regular intervals for backups, the storage engines are equally easy to deal with. However, if you need to perform online backups in one form or another, the choices become less clear. Also bear in mind that using multiple storage engines increases the complexity of backups and server tuning.
If you have a lot of data, you should seriously consider how long it will take to recover from a crash. MyISAM tables generally become corrupt more easily and take much longer to recover than InnoDB tables, for example. In fact, this is one of the most important reasons why a lot of people use InnoDB when they don’t need transactions.
更改storage engine
mysql> ALTER TABLE mytable ENGINE = Falcon;
缺點是速度比較慢,MySQL will perform a row-by-row copy of your old table into a new table. During that time, you’ll probably be using all of the server’s disk I/O capacity, and the original table will be read-locked while the conversion runs.
Once you’ve dumped the table, you can simply edit the dump file to adjust the CREATE TABLE statement it contains. Be sure to change the table name as well as its type, because you can’t have two tables with the same name in the same database even if they are of different types—and mysqldump defaults to writing a DROP TABLE command before the CREATE TABLE, so you might lose your data if you are not careful!
mysql> CREATE TABLE innodb_table LIKE myisam_table;
mysql> ALTER TABLE innodb_table ENGINE=InnoDB;
mysql> INSERT INTO innodb_table SELECT * FROM myisam_table;
這種方式最安全,畢竟如果源表存在大量的數據,最好采用增量插入和提交的方式,以加快速度。方法如下:
mysql> START TRANSACTION;
mysql> INSERT INTO innodb_table SELECT * FROM myisam_table
-> WHERE id BETWEEN x AND y;
mysql> COMMIT;
Benchmarking and Profiling
Performance Measurements
- Transactions per time unit or throughput
The usual unit of measurement is transactions per second.
Maximum response time is rarely a useful metric, because the longer the bench-mark runs, the longer the maximum response time is likely to be. It’s also not at all repeatable, as it’s likely to vary widely between runs. For this reason, many people use percentile response times instead. For example, if the 95th percentile response time is 5 milliseconds, you know that the task finishes in less than 5 milliseconds 95% of the time.
Scalability measurements are useful for systems that need to maintain performance under a changing workload.
“Performance under a changing workload” is a fairly abstract concept. Performance is typically measured by a metric such as throughput or response time, and the workload may vary along with changes in database size, number of con-current connections, or hardware.
Scalability measurements are good for capacity planning, because they can show weaknesses in your application that other benchmark strategies won’t show.
Benchmarking Tools
Full-Stack Tools:ab,http_load,jmeter
Single-Component Tools: mysqlslap,sysbench,Database Test Suite,MySQL Benchmark Suite (sql-bench),Super Smack
MySQL Profiling
- Which data MySQL accesses most
- What kinds of queries MySQL executes most
- What states MySQL threads spend the most time in
- What subsystems MySQL uses most to execute a query
- What kinds of data accesses MySQL does during a query
- How much of various kinds of activities, such as index scans, MySQL does
MySQL has two kinds of query logs: the general log and the slow log.
The general log writes out every query as the server receives it, so it contains queries that may not even be executed due to errors. You can enable it with a single configuration directive:
log = <file_name>
By design, the general log does not contain execution times or any other information that’s available only after a query finishes. In contrast, the slow log contains only queries that have executed, it logs queries that take more than a specified amount of time to execute. Both logs can be helpful for profiling, but the slow log is the primary tool for catching problematic queries. We usually recommend
enabling it.
The following configuration sample will enable the log, capture all queries that take more than two seconds to execute, and log queries that don’t use any indexes. It will also log slow administrative statements, such as OPTIMIZE TABLE:
log-slow-queries = <file_name>
long_query_time = 2
log-queries-not-using-indexes
log-slow-admin-statements
You should customize this sample and place it in your my.cnf server configuration file.
In MySQL 5.1, the global slow_query_log and slow_query_log_file system variables provide runtime control over the slow query log, but in MySQL 5.0, you can’t turn the slow query log on or off without restarting the MySQL server. The usual workaround for MySQL 5.0 is the long_query_time variable, which you can change dynamically. The following command doesn’t really disable slow query logging, but it has practically the same effect (if any of your queries takes longer than 10,000 seconds to execute, you should optimize it anyway!):
mysql> SET GLOBAL long_query_time = 10000;
A related configuration variable, log_queries_not_using_indexes, makes the server log to the slow log any queries that don’t use indexes, no matter how quickly theyexecute. Although enabling the slow log normally adds only a small amount of log-ging overhead relative to the time it takes a “slow” query to execute, queries that don’t use indexes can be frequent and very fast (for example, scans of very small tables). Thus, logging them can cause the server to slow down, and even use a lot of disk space for the log.
Unfortunately, you can’t enable or disable logging of these queries with a dynamically settable variable in MySQL 5.0. You have to edit the configuration file, then restart MySQL. One way to reduce the burden without a restart is to make the log file a symbolic link to /dev/null when you want to disable it (in fact, you can use this trick for any log file). You just need to run FLUSH LOGS after making the change to ensure that MySQL closes its current log file descriptor and reopens the log to /dev/null.
In contrast to MySQL 5.0, MySQL 5.1 lets you change logging at runtime and lets you log to tables you can query with SQL. This is a great improvement.
Note:The minimum value for long_query_time in MySQL 5.0 is one second,for most interactive applications, this is way too long.
Slow log是有一系列不足的,包括最小單位是太大(1秒),不能log slave thread query
http://www.mysqlperformanceblog.com/mysql-patches/ 提供了一個補丁,可以彌補上述不足
When profiling, it’s a good idea to log all queries with long_query_time=0
Appearing in the log simply means the query took a long time then; it doesn’t mean it will take a long time now or in the future. There
are many reasons why a query can be slow sometimes and fast at other times:
? A table may have been locked, causing the query to wait. The Lock_time indi-cates how long the query waited for locks to be released.
? The data or indexes may not have been cached in memory yet. This is common when MySQL is first started or hasn’t been well tuned.
? A nightly backup process may have been running, making all disk I/O slower.
? The server may have been running other queries at the same time, slowing down this query.
As a result, you should view the slow query log as only a partial record of what’s happened. You can use it to generate a list of possible suspects, but you need to investigate each of them in more depth.
The slow query log patches are specifically designed to try to help you understand why a query is slow. In particular, if you’re using InnoDB, the InnoDB statistics can help a lot: you can see if the query was waiting for I/O from the disk, whether it had to spend a lot of time waiting in the InnoDB queue, and so on.
Log analysis tools:mysqldumpslow,mysql_slow_log_filter,mysql_slow_log_parser,mysqlsla
In general, MySQL can apply a WHERE clause in three ways, from best to worst:
? Apply the conditions to the index lookup operation to eliminate nonmatching rows. This happens at the storage engine layer.
? Use a covering index (“Using index” in the Extra column) to avoid row accesses, and filter out nonmatching rows after retrieving each result from the index. This happens at the server layer, but it doesn’t require reading rows from the table.
? Retrieve rows from the table, then filter nonmatching rows (“Using where” in the Extra column). This happens at the server layer and requires the server to read rows from the table before it can filter them.
- 一條 SQL 語句只能使用 1 個索引 (5.0-),MySQL 根據表的狀態,選擇一個它認為最好的索引用于優化查詢
- 聯合索引,只能按從左到右的順序依次使用
總結一下:
1.一般有order by語句,在索引加得不當的情況下,都有可能出現Using filesort,這時候就要對SQL語句和索引進行優化了,但是,并不是說出現Using filesort就是個嚴重的問題,不是這樣的,此次舉的例子比較極端,幾乎不太可能出現這么傻瓜的查詢,優化和不優化,要看它是不是影響了業務性能。
2. 從上面可以看到聯合索引,也可以叫多列索引,形如 key ('A1','A2','A3' ,'A4')等的,排序的思路一般是,先按照A1來排序,A1相同,然后按照A2排序,以此類推,這樣對于(A1),(A1,A2), (A1,A2,A3)的索引都是有效的,但是對于(A2,A3)這樣的索引就無效了。