RGraph2
RGraph是一個基于Raphaeljs完整的點->線圖的web實現����。
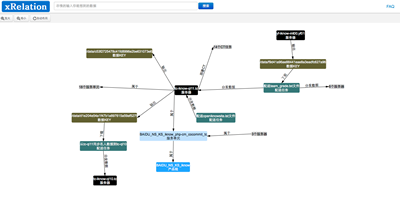
online demo :RGraph2 Demo
github地址 :
git clone https://github.com/hafeyang/rgraph2.git
RGraph2已經支持bower包規范����,可以直接使用bower安裝
bower install rgraph2
由于Raphaeljs目前不支持bower規范,所以沒有引入Raphaeljs依賴
RGraph包含特性:
- 點->線圖布局算法(2.0新增)
- 基本畫布拖拽
- 點拖動�,鼠標hover高亮相關點
- 支持放大/縮小/鼠標滾輪事件
- 提供API增/刪/改節點
Quick Demo
<script type="text/javascript" src="https://raw.github.com/hafeyang/rgraph2/master/lib/raphael-min.js"></script>
<script type="text/javascript" src="https://raw.github.com/hafeyang/rgraph2/master/lib/rgraph2.js"></script>
<script type="text/javascript">
var graph = new RGraph("canvas");
//加載數據
graph.loadData({
nodes:{
//label:顯示文字�,支持Raphael.fullfill格式���。
//rectStyle,textStyle 文本框的顏色����,文字顏色
"1":{"label":"{name}",name:"節點1",rectStyle:{fill:"#616130",stroke:"#616130"},textStyle:{fill:"#fff"}},
"2":{"label":"節點2"}
},
edges:[
//source,target 是節點的ID ,箭頭由source->target
//arrowStyle,指定箭頭顏色
{source:"1",target:"2",label:"1->2",arrowStyle:{fill:"#ab4",stroke:"#ab4"}}
]
});
//將ID為1的節點移至視口中央
graph.center("1");
</script>
初始化參數
var graph = new RGraph("canvas",opts);
opts.drawNodeFn
繪制節點的Raphaeljs擴展方法����,默認為rgraphnode,RGraph2內部默認實現����,自定義節點繪制方法為:
(!Raphael.fn.rgraphnode ) && (Raphael.fn.rgraphnode=function(node){
// your implementation
return {
//移動節點時會調用該方法
move:function(dx,dy){},
//高亮節點時會調用該方法
highlight:function(){},
//清除高亮
unhighlight:function(){},
//更新節點文本
update:function(){}
}
});
具體可以參見RGraph2內部實現
opts.onnodeclick(e,node)
節點節點觸發function����,參數event,node
opts.onnodemouseover(e,node)
節點mouseover觸發function����,參數event,node
opts.onnodemouseout(e,node)
節點mouseout觸發function,參數event,node
opts.nnodestartdrag(e,node)
節點開始拖拽觸發function,參數event,node
opts.onnodedragging(e,node)
節點拖拽中觸發function,參數event,node
opts.onnodeenddrag(e,node)
節點拖拽結束觸發function�,參數event,node
API
調用方法:graphInstance.method()
instance.removeNode(nodeId)
刪除節點以及節點相關的線
instance.updateNode(nodeId)
更新節點文本
var node = graphInstance.getNode("nodeId");
node.label = "{name} after update";
graphInstance.updateNode(node.nodeId);
instance.getNode(nodeId)
根據節點ID獲取節點對象
instance.addNode(node)
添加節點�,節點必須有nodeId,label屬性,rectStyle用于定義節點邊框樣式���,樣式格式詳見Raphaeljs Element.attr,textStyle定義文字樣式�。
新增文字節點位置視口內隨機���。
graphInstance.addNode({nodeId:"nodeId---",label:"{nodename}",nodename:"Name"});
instance.existEdge(sourceNodeId,targetNodeId)
是否存在sourceNode與targetNode之間的線�,如果有返回該Edge對象���,否則返回false
instance.addEdge(edge)
添加一條線����,edge必須有source,target屬性箭頭由source->target,label屬性定義箭頭上的label文字�。arrowStyle定義箭頭的顏色樣式����,格式以及可以設置的屬性參見 Raphaeljs Element.attr
instance.loadData(graphData)
加載圖數據����,數據格式見demo
instance.relayout()
重新布局點->線位置
instance.getNodeEdges(nodeId)
根據nodeId獲取節點相關的邊
instane.reset()
方法倍數設置成1。視口還原����。
instance.center(nodeId)
將nodeId節點移至視口中央
References
Raphaeljs
Graph JavaScript framework
Graph visualization code in javascript
JavaScript Graph Library Showcase
Knows Issues
Raphaeljs Element.getBBox方法在IE<9下獲取值不正確導致IE9下不能兼容
Thanks����,any questions ,contact me freely!