摘要:Perf是Linux kernel自帶的系統(tǒng)性能優(yōu)化工具。Perf的優(yōu)勢在于與Linux Kernel的緊密結(jié)合,它可以最先應(yīng)用到加入Kernel的new feature。pef可以用于查看熱點(diǎn)函數(shù),查看cashe miss的比率,從而幫助開發(fā)者來優(yōu)化程序性能。
1.perf的安裝
由于我們經(jīng)常是在自己編譯的內(nèi)核上進(jìn)行開發(fā)工作,這里需要有包含調(diào)式信息的內(nèi)核啟動鏡像文件vmlinux,在自定義內(nèi)核的基礎(chǔ)之上,進(jìn)入linux內(nèi)核源碼,linux/tools/perf
make
make install
提示:
1)可能在編譯的時(shí)候,有報(bào)錯大概是由于平臺問題,數(shù)據(jù)類型不匹配,導(dǎo)致所有的warning都被當(dāng)作error對待:出現(xiàn)這問題的原因是-Werror這個gcc編譯選項(xiàng)。只要在makefile中找到包含這個-Werror選項(xiàng)的句子,將-Werror刪除,或是注釋掉就行了
2)安裝完畢,perf可執(zhí)行程序往往位于當(dāng)前目錄,可能不在系統(tǒng)的PATH路徑中,此時(shí)需要改變環(huán)境變量PATH
2.perf的運(yùn)行原理
性能調(diào)優(yōu)工具如 perf,Oprofile 等的基本原理都是對被監(jiān)測對象進(jìn)行采樣,最簡單的情形是根據(jù) tick 中斷進(jìn)行采樣,即在 tick 中斷內(nèi)觸發(fā)采樣點(diǎn),在采樣點(diǎn)里判斷程序當(dāng)時(shí)的上下文。假如一個程序 90% 的時(shí)間都花費(fèi)在函數(shù) foo() 上,那么 90% 的采樣點(diǎn)都應(yīng)該落在函數(shù) foo() 的上下文中。運(yùn)氣不可捉摸,但我想只要采樣頻率足夠高,采樣時(shí)間足夠長,那么以上推論就比較可靠。因此,通過 tick 觸發(fā)采樣,我們便可以了解程序中哪些地方最耗時(shí)間,從而重點(diǎn)分析。
稍微擴(kuò)展一下思路,就可以發(fā)現(xiàn)改變采樣的觸發(fā)條件使得我們可以獲得不同的統(tǒng)計(jì)數(shù)據(jù):
以時(shí)間點(diǎn) ( 如 tick) 作為事件觸發(fā)采樣便可以獲知程序運(yùn)行時(shí)間的分布。
以 cache miss 事件觸發(fā)采樣便可以知道 cache miss 的分布,即 cache 失效經(jīng)常發(fā)生在哪些程序代碼中。如此等等。
因此讓我們先來了解一下 perf 中能夠觸發(fā)采樣的事件有哪些。
使用perf list(在root權(quán)限下運(yùn)行),可以列出所有的采樣事件

事件分為以下三種:
1)Hardware Event 是由 PMU 硬件產(chǎn)生的事件,比如 cache 命中,當(dāng)您需要了解程序?qū)τ布匦缘氖褂们闆r時(shí),便需要對這些事件進(jìn)行采樣;
2)Software Event 是內(nèi)核軟件產(chǎn)生的事件,比如進(jìn)程切換,tick 數(shù)等 ;
3)Tracepoint event 是內(nèi)核中的靜態(tài) tracepoint 所觸發(fā)的事件,這些 tracepoint 用來判斷程序運(yùn)行期間內(nèi)核的行為細(xì)節(jié),比如 slab 分配器的分配次數(shù)等。
上述每一個事件都可以用于采樣,并生成一項(xiàng)統(tǒng)計(jì)數(shù)據(jù),時(shí)至今日,尚沒有文檔對每一個 event 的含義進(jìn)行詳細(xì)解釋。
3.perfstat——概覽程序的運(yùn)行情況
面對一個問題程序,最好采用自頂向下的策略。先整體看看該程序運(yùn)行時(shí)各種統(tǒng)計(jì)事件的大概,再針對某些方向深入細(xì)節(jié)。而不要一下子扎進(jìn)瑣碎細(xì)節(jié),會一葉障目的。
有些程序慢是因?yàn)橛?jì)算量太大,其多數(shù)時(shí)間都應(yīng)該在使用CPU進(jìn)行計(jì)算,這叫做CPUbound型;有些程序慢是因?yàn)檫^多的IO,這種時(shí)候其CPU利用率應(yīng)該不高,這叫做IObound型;對于CPUbound程序的調(diào)優(yōu)和IObound的調(diào)優(yōu)是不同的。
如果您認(rèn)同這些說法的話,Perfstat應(yīng)該是您最先使用的一個工具。它通過概括精簡的方式提供被調(diào)試程序運(yùn)行的整體情況和匯總數(shù)據(jù)。
本篇中,我們將在以后使用這個例子test1.c:
測試用例:test1
<SPAN style="FONT-SIZE: 14px"> //test.c
void longa()
{
int i,j;
for(i = 0; i < 1000000; i++)
j=i; //am I silly or crazy? I feel boring and desperate.
} void foo2()
{
int i;
for(i=0 ; i < 10; i++)
longa();
} void foo1()
{
int i;
for(i = 0; i< 100; i++)
longa();
} int main(void)
{
foo1();
foo2();
} </SPAN> |
將它編譯為可執(zhí)行文件 test1
gcc – o test1 – g test.c
注意:此處一定要加-g選項(xiàng),加入調(diào)試和符號表信息。
下面演示了 perf stat 針對程序 test1 的輸出:
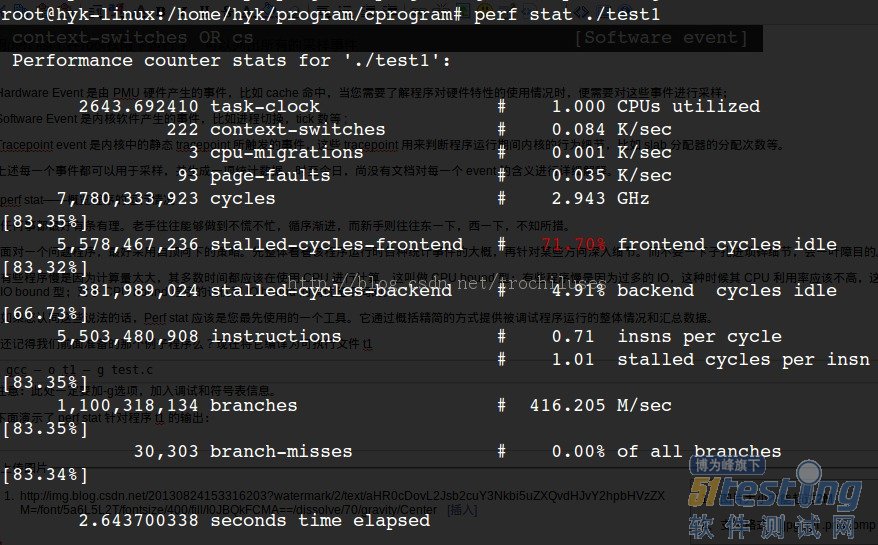
結(jié)果分析:
對 test1進(jìn)行調(diào)優(yōu)應(yīng)該要找到熱點(diǎn) ( 即最耗時(shí)的代碼片段 ),再看看是否能夠提高熱點(diǎn)代碼的效率。
缺省情況下,除了 task-clock-msecs 之外,perf stat 還給出了其他幾個最常用的統(tǒng)計(jì)信息:
Task-clock-msecs:CPU 利用率,該值高,說明程序的多數(shù)時(shí)間花費(fèi)在 CPU 計(jì)算上而非 IO。
Context-switches:進(jìn)程切換次數(shù),記錄了程序運(yùn)行過程中發(fā)生了多少次進(jìn)程切換,頻繁的進(jìn)程切換是應(yīng)該避免的。
Cache-misses:程序運(yùn)行過程中總體的 cache 利用情況,如果該值過高,說明程序的 cache 利用不好
CPU-migrations:表示進(jìn)程 t1 運(yùn)行過程中發(fā)生了多少次 CPU 遷移,即被調(diào)度器從一個 CPU 轉(zhuǎn)移到另外一個 CPU 上運(yùn)行。
Cycles:處理器時(shí)鐘,一條機(jī)器指令可能需要多個 cycles,
Instructions: 機(jī)器指令數(shù)目。
IPC:是 Instructions/Cycles 的比值,該值越大越好,說明程序充分利用了處理器的特性。
Cache-references: cache 命中的次數(shù)
Cache-misses: cache 失效的次數(shù)。
4.精確制導(dǎo)——定位程序瓶頸perf record && perf report
4.1查找時(shí)間上的熱點(diǎn)函數(shù)
perf record – e cpu-clock ./test1
perf report
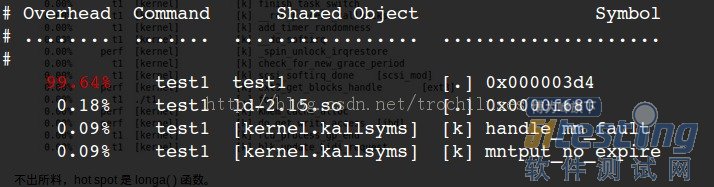
3個問題:
1)perf未能定位本地符號表對應(yīng)的symbol和地址的對應(yīng)關(guān)系:0x000003d4對應(yīng)的什么函數(shù)?
2)采樣頻率不夠高,失去了一些函數(shù)的信息:顯然一些內(nèi)核函數(shù)沒有顯示在上面的結(jié)果中,因?yàn)椴蓸宇l率如果不夠高,那么勢必會有一些函數(shù)中的采樣點(diǎn)沒有/
3)如何克服采樣的隨機(jī)性帶來的問題:為了在測量更加逼近正確值,我們采用多次重復(fù)取平均值的方法來逼近真實(shí)值。(這里可以用-r來指定重復(fù)次數(shù))
對于問題2),我們可以用perf record -F count 來指定采樣頻率加以解決:
<SPAN style="FONT-SIZE: 14px">root@hyk-linux:/home/hyk/program/cprogram# perf record -F 50000 -e cpu-clock ./test1
[ perf record: Woken up 3 times to write data ]
[ perf record: Captured and wrote 0.532 MB perf.data (~23245 samples) ]
root@hyk-linux:/home/hyk/program/cprogram# perf report
# ========
# captured on: Mon Aug 26 09:54:45 2013
# hostname : hyk-linux
# os release : 3.10.9
# perf version : 3.10.9
# arch : i686
# nrcpus online : 4
# nrcpus avail : 4
# cpudesc : Intel(R) Core(TM) i5-2430M CPU @ 2.40GHz
# cpuid : GenuineIntel,6,42,7
# total memory : 4084184 kB
# cmdline : /media/usr/src/linux-3.10.9/tools/perf/perf record -F 50000 -e cpu-c
# event : name = cpu-clock, type = 1, config = 0x0, config1 = 0x0, config2 = 0x0
# HEADER_CPU_TOPOLOGY info available, use -I to display
# pmu mappings: cpu = 4, software = 1, tracepoint = 2, uncore_cbox_0 = 6, uncore
# ========
#
# Samples: 13K of event 'cpu-clock'
# Event count (approx.): 273580000
#
# Overhead Command Shared Object Symbol
# ........ ....... ................. ...............................
#
99.77% test1 test1 [.] 0x000003c3
0.07% test1 ld-2.15.so [.] 0x00004c99
0.02% test1 [kernel.kallsyms] [k] __wake_up_bit
0.01% test1 [kernel.kallsyms] [k] __kunmap_atomic
0.01% test1 [kernel.kallsyms] [k] load_elf_binary
0.01% test1 [kernel.kallsyms] [k] _raw_spin_unlock_irqrestore
0.01% test1 libc-2.15.so [.] 0x00097d8e
0.01% test1 [kernel.kallsyms] [k] exit_itimers
0.01% test1 [kernel.kallsyms] [k] profile_munmap
0.01% test1 [kernel.kallsyms] [k] get_page_from_freelist
0.01% test1 [kernel.kallsyms] [k] vma_interval_tree_remove
0.01% test1 [kernel.kallsyms] [k] change_protection
0.01% test1 [kernel.kallsyms] [k] link_path_walk
0.01% test1 [kernel.kallsyms] [k] prepend_path
0.01% test1 [kernel.kallsyms] [k] __inode_wait_for_writeback
0.01% test1 [kernel.kallsyms] [k] aa_free_task_context
0.01% test1 [kernel.kallsyms] [k] radix_tree_lookup_element
0.01% test1 [kernel.kallsyms] [k] _raw_spin_lock </SPAN> |
結(jié)果解釋:
The column 'Overhead' indicates the percentage of the overall samples collected in the corresponding function. The second column reports the process from which the samples were collected. In per-thread/per-process mode, this is always the name of the monitored command. But in cpu-wide mode, the command can vary. The third column shows the name of the ELF image where the samples came from. If a program is dynamically linked, then this may show the name of a shared library. When the samples come from the kernel, then the pseudo ELF image name [kernel.kallsyms] is used. The fourth column indicates the privilege level at which the sample was taken, i.e. when the program was running when it was interrupted:
[.] : user level
[k]: kernel level
[g]: guest kernel level (virtualization)
[u]: guest os user space
[H]: hypervisor
The final column shows the symbol name.
代碼是非常復(fù)雜難說的,t1 程序中的 foo1() 也是一個潛在的調(diào)優(yōu)對象,為什么要調(diào)用 100 次那個無聊的 longa() 函數(shù)呢?但我們在上圖中無法發(fā)現(xiàn) foo1 和 foo2,更無法了解他們的區(qū)別了。
我曾發(fā)現(xiàn)自己寫的一個程序居然有近一半的時(shí)間花費(fèi)在 string 類的幾個方法上,string 是 C++ 標(biāo)準(zhǔn),我絕不可能寫出比 STL 更好的代碼了。因此我只有找到自己程序中過多使用 string 的地方。因此我很需要按照調(diào)用關(guān)系進(jìn)行顯示的統(tǒng)計(jì)信息。
使用 perf 的 -g 選項(xiàng)便可以得到需要的信息:
perf record -g -e cpu-clock ./test1
perf report

當(dāng)然,這里符號表沒有定位的問題有依然沒有解決!
perf record的其他參數(shù):
-f:強(qiáng)制覆蓋產(chǎn)生的.data數(shù)據(jù)
-c:事件每發(fā)生count次采樣一次
-p:指定進(jìn)程
-t:指定線程
4.2 perf report的相關(guān)參數(shù):
-k:指定未經(jīng)壓縮的內(nèi)核鏡像文件,從而獲得內(nèi)核相關(guān)信息
--report:cpu按照cpu列出負(fù)載
5.使用tracepoint
當(dāng) perf 根據(jù) tick 時(shí)間點(diǎn)進(jìn)行采樣后,人們便能夠得到內(nèi)核代碼中的 hot spot。那什么時(shí)候需要使用 tracepoint 來采樣呢?
我想人們使用 tracepoint 的基本需求是對內(nèi)核的運(yùn)行時(shí)行為的關(guān)心,如前所述,有些內(nèi)核開發(fā)人員需要專注于特定的子系統(tǒng),比如內(nèi)存管理模塊。這便需要統(tǒng)計(jì)相關(guān)內(nèi)核函數(shù)的運(yùn)行情況。另外,內(nèi)核行為對應(yīng)用程序性能的影響也是不容忽視的:
以之前的遺憾為例,假如時(shí)光倒流,我想我要做的是統(tǒng)計(jì)該應(yīng)用程序運(yùn)行期間究竟發(fā)生了多少次系統(tǒng)調(diào)用。在哪里發(fā)生的?
下面我用 ls 命令來演示 sys_enter 這個 tracepoint 的使用:
[root@ovispoly /]# perf stat -e raw_syscalls:sys_enter ls
bin dbg etc lib media opt root
selinux sys usr
boot dev home lost+found mnt proc sbin srv
tmp var
Performance counter stats for 'ls':
101 raw_syscalls:sys_enter
0.003434730 seconds time elapsed
[root@ovispoly /]# perf record -e raw_syscalls:sys_enter ls
[root@ovispoly /]# perf report
Failed to open .lib/ld-2.12.so, continuing without symbols
# Samples: 70
#
# Overhead Command Shared Object Symbol
# ........ ............... ............... ......
#
97.14% ls ld-2.12.so [.] 0x0000000001629d
2.86% ls [vdso] [.] 0x00000000421424
#
# (For a higher level overview, try: perf report --sort comm,dso)
# |
這個報(bào)告詳細(xì)說明了在 ls 運(yùn)行期間發(fā)生了多少次系統(tǒng)調(diào)用 ( 上例中有 101 次 ),多數(shù)系統(tǒng)調(diào)用都發(fā)生在哪些地方 (97% 都發(fā)生在 ld-2.12.so 中 )。
有了這個報(bào)告,或許我能夠發(fā)現(xiàn)更多可以調(diào)優(yōu)的地方。比如函數(shù) foo() 中發(fā)生了過多的系統(tǒng)調(diào)用,那么我就可以思考是否有辦法減少其中有些不必要的系統(tǒng)調(diào)用。
您可能會說 strace 也可以做同樣事情啊,的確,統(tǒng)計(jì)系統(tǒng)調(diào)用這件事完全可以用 strace 完成,但 perf 還可以干些別的,您所需要的就是修改 -e 選項(xiàng)后的字符串。
羅列 tracepoint 實(shí)在是不太地道,本文當(dāng)然不會這么做。但學(xué)習(xí)每一個 tracepoint 是有意義的,類似背單詞之于學(xué)習(xí)英語一樣,是一項(xiàng)緩慢痛苦卻不得不做的事情。'
5.2同樣,我們跟蹤一下wirteback子系統(tǒng)的相關(guān)情況:
<SPAN style="FONT-SIZE: 14px">root@hyk-linux:/home/hyk/program/cprogram# perf record -e writeback:* lsa.out cscope.po.out perf.data.old t2.c test1 testperf
cscope.in.out malloc.c t1 tags test1s testperf.c
cscope.out perf.data t2 test test.img
[ perf record: Woken up 1 times to write data ]
[ perf record: Captured and wrote 0.013 MB perf.data (~548 samples) ]
root@hyk-linux:/home/hyk/program/cprogram# perf report
# ========
# captured on: Mon Aug 26 08:59:58 2013
# hostname : hyk-linux
# os release : 3.10.9
# perf version : 3.10.9
# arch : i686
# nrcpus online : 4
# nrcpus avail : 4
# cpudesc : Intel(R) Core(TM) i5-2430M CPU @ 2.40GHz
# cpuid : GenuineIntel,6,42,7
# total memory : 4084184 kB
# cmdline : /media/usr/src/linux-3.10.9/tools/perf/perf record -e writeback:* ls
# event : name = writeback:writeback_dirty_page, type = 2, config = 0x291, confi
# event : name = writeback:writeback_dirty_inode_start, type = 2, config = 0x290
# event : name = writeback:writeback_dirty_inode, type = 2, config = 0x28f, conf
# event : name = writeback:writeback_write_inode_start, type = 2, config = 0x28e
# event : name = writeback:writeback_write_inode, type = 2, config = 0x28d, conf
# event : name = writeback:writeback_queue, type = 2, config = 0x28c, config1 =
# event : name = writeback:writeback_exec, type = 2, config = 0x28b, config1 = 0
# event : name = writeback:writeback_start, type = 2, config = 0x28a, config1 =
# event : name = writeback:writeback_written, type = 2, config = 0x289, config1
# event : name = writeback:writeback_wait, type = 2, config = 0x288, config1 = 0
# event : name = writeback:writeback_pages_written, type = 2, config = 0x287, co
# event : name = writeback:writeback_nowork, type = 2, config = 0x286, config1 =
# event : name = writeback:writeback_wake_background, type = 2, config = 0x285,
# event : name = writeback:writeback_bdi_register, type = 2, config = 0x284, con
# event : name = writeback:writeback_bdi_unregister, type = 2, config = 0x283, c
# event : name = writeback:wbc_writepage, type = 2, config = 0x282, config1 = 0x
# event : name = writeback:writeback_queue_io, type = 2, config = 0x281, config1
# event : name = writeback:global_dirty_state, type = 2, config = 0x280, config1
# event : name = writeback:bdi_dirty_ratelimit, type = 2, config = 0x27f, config
# event : name = writeback:balance_dirty_pages, type = 2, config = 0x27e, config
# event : name = writeback:writeback_sb_inodes_requeue, type = 2, config = 0x27d
# event : name = writeback:writeback_congestion_wait, type = 2, config = 0x27c,
# event : name = writeback:writeback_wait_iff_congested, type = 2, config = 0x27
# event : name = writeback:writeback_single_inode_start, type = 2, config = 0x27
# event : name = writeback:writeback_single_inode, type = 2, config = 0x279, con
# HEADER_CPU_TOPOLOGY info available, use -I to display
# pmu mappings: cpu = 4, software = 1, tracepoint = 2, uncore_cbox_0 = 6, uncore
# ========
#
# Samples: 0 of event 'writeback:writeback_dirty_page'
# Event count (approx.): 0
#
# Overhead Command Shared Object Symbol
# ........ ....... ............. ......
#
# Samples: 1 of event 'writeback:writeback_dirty_inode_start'
# Event count (approx.): 1
#
# Overhead Command Shared Object Symbol
# ........ ....... ................. ......................
#
100.00% ls [kernel.kallsyms] [k] __mark_inode_dirty
# Samples: 1 of event 'writeback:writeback_dirty_inode'
# Event count (approx.): 1
#
# Overhead Command Shared Object Symbol
# ........ ....... ................. ......................
#
100.00% ls [kernel.kallsyms] [k] __mark_inode_dirty
# Samples: 0 of event 'writeback:writeback_write_inode_start'
# Event count (approx.): 0
#
# Overhead Command Shared Object Symbol
# ........ ....... ............. ......
#
# Samples: 0 of event 'writeback:writeback_write_inode'
# Event count (approx.): 0
#
# Overhead Command Shared Object Symbol
# ........ ....... ............. ......
#
# Samples: 0 of event 'writeback:writeback_queue'
# Event count (approx.): 0
#
# Overhead Command Shared Object Symbol
# ........ ....... ............. ......
#
# Samples: 0 of event 'writeback:writeback_exec'
# Event count (approx.): 0
#
# Overhead Command Shared Object Symbol
# ........ ....... ............. ......
#
# Samples: 0 of event 'writeback:writeback_start'
# Event count (approx.): 0
#
# Overhead Command Shared Object Symbol
# ........ ....... ............. ......
#
# Samples: 0 of event 'writeback:writeback_written'
# Event count (approx.): 0
#
# Overhead Command Shared Object Symbol
# ........ ....... ............. ......
#
# Samples: 0 of event 'writeback:writeback_wait'
# Event count (approx.): 0
#
# Overhead Command Shared Object Symbol
# ........ ....... ............. ......
#
# Samples: 0 of event 'writeback:writeback_pages_written'
# Event count (approx.): 0
#
# Overhead Command Shared Object Symbol
# ........ ....... ............. ......
#
# Samples: 0 of event 'writeback:writeback_nowork'
# Event count (approx.): 0
#
# Overhead Command Shared Object Symbol
# ........ ....... ............. ......
#
# Samples: 0 of event 'writeback:writeback_wake_background'
# Event count (approx.): 0
#
# Overhead Command Shared Object Symbol
# ........ ....... ............. ......
#
# Samples: 0 of event 'writeback:writeback_bdi_register'
# Event count (approx.): 0
#
# Overhead Command Shared Object Symbol
# ........ ....... ............. ......
#
# Samples: 0 of event 'writeback:writeback_bdi_unregister'
# Event count (approx.): 0
#
# Overhead Command Shared Object Symbol
# ........ ....... ............. ......
#
# Samples: 0 of event 'writeback:wbc_writepage'
# Event count (approx.): 0
#
# Overhead Command Shared Object Symbol
# ........ ....... ............. ......
#
# Samples: 0 of event 'writeback:writeback_queue_io'
# Event count (approx.): 0
#
# Overhead Command Shared Object Symbol
# ........ ....... ............. ......
#
# Samples: 0 of event 'writeback:global_dirty_state'
# Event count (approx.): 0
#
# Overhead Command Shared Object Symbol
# ........ ....... ............. ......
#
# Samples: 0 of event 'writeback:bdi_dirty_ratelimit'
# Event count (approx.): 0
#
# Overhead Command Shared Object Symbol
# ........ ....... ............. ......
#
# Samples: 0 of event 'writeback:balance_dirty_pages'
# Event count (approx.): 0
#
# Overhead Command Shared Object Symbol
# ........ ....... ............. ......
#
# Samples: 0 of event 'writeback:writeback_sb_inodes_requeue'
# Event count (approx.): 0
#
# Overhead Command Shared Object Symbol
# ........ ....... ............. ......
#
# Samples: 0 of event 'writeback:writeback_congestion_wait'
# Event count (approx.): 0
#
# Overhead Command Shared Object Symbol
# ........ ....... ............. ......
</SPAN> |