前言
引用一老程序員同事的一句話:“項目做到最后就是監(jiān)控了。”在一天和那同事打電話聊天時他突然冒出來的一句話。后來我仔細回味這句話,越來越覺得挺有道理的。自己在現(xiàn)在的項目里就做了好幾個監(jiān)控相關的任務,而且也一直在想辦法獲取更多的監(jiān)控數(shù)據(jù),如每個進程內(nèi)存使用情況、線程使用狀態(tài)、某些方法的性能等。不過這句話只說了一半,監(jiān)控是為了獲取數(shù)據(jù),但是有了數(shù)據(jù)后還要根據(jù)這些數(shù)據(jù)來做相應的決策,比如判斷機器、進程的健康狀況,如何改進系統(tǒng)等。最近對性能調(diào)優(yōu)特別感興趣,但是在性能調(diào)優(yōu)前首先要收集性能數(shù)據(jù),因而本文打算研究一下perf4j的實現(xiàn)和使用,以獲取性能數(shù)據(jù),后期可以繼續(xù)寫一些如何調(diào)優(yōu)的文章。
性能調(diào)優(yōu)分三步驟:1. 性能數(shù)據(jù)收集;2. 性能數(shù)據(jù)分析;3. 根據(jù)分析后的數(shù)據(jù)、代碼以及系統(tǒng)特性進行調(diào)優(yōu),perf4j主要用于處理前兩種情況,并且這兩部分分開。
性能數(shù)據(jù)收集
性能數(shù)據(jù)收集是一件比較簡單的事情,說白了就是在一段邏輯開始和結束的時間差值,一般可以將該值輸出日志文件中,供后繼分析。比如最簡單的一種方式: long startTime = System.currentTimeMillis();
methodToMeasure();
long timeSpend = System.currentTimeMillis() - startTime;
System.out.println("methodToMeasure took: " + timeSpend);
當然這種代碼太原始,也太麻煩,在實際項目中,一般都把這部分邏輯抽象出一個StopWatch類: StopWatch stopWatch = new StopWatch();
methodToMeasure();
System.out.println(stopWatch.stop("methodToMeasure"));
//output: start[1429350898550] time[66] tag[methodToMeasure]
也可以在日志中添加額外的信息:
System.out.println(stopWatch.stop("methodToMeasure", "A simple test method"));
//output: start[1429351112097] time[3] tag[methodToMeasure] message[A simple test method]
perf4j中StopWatch的實現(xiàn)非常簡單,它只是對上面代碼的一個簡單封裝,為了提高精確度,它使用System.nanoTime()來紀錄時間差值,另外它引入了tag的概念,從而在后期分析的時候可以將相同的操作組合在一起形成一些統(tǒng)計數(shù)據(jù),在perf4j的日志分析支持tag的層級結構,它使用dot來分隔,而message只是對當前日志的一種額外說明,這里不再贅述。另外在Guava和Apache Commons Lang項目中都提供了StopWatch類,而且他們打印的格式更具可讀性,perf4j這里打印的簡單格式主要為了后期統(tǒng)計分析,因而采用了更加簡單的格式。
其實以上的代碼還可以進一步封裝:既然最后都是要打印這些信息的,直接在stop()方法中打印不就可以了?因而perf4j提供了LoggingStopWatch類,它將日志信息輸出到System.err中: StopWatch stopWatch = new LoggingStopWatch();
methodToMeasure();
stopWatch.stop("methodToMeasure", "A simple test method");
LoggingStopWatch添加了兩個額外特性:可以設置打印閥值,只有當某段邏輯超過這個閥值后才打印日志,或者將這個閥值一下和以上的tag使用不同的后綴分開(默認后綴:.normal/.slow),并且它可以同時打印Exception信息: stopWatch.setTimeThreshold(50);
stopWatch.setNormalAndSlowSuffixesEnabled(true);
//output:
// start[1429352833043] time[71] tag[methodToMeasure.slow]
// start[1429352833115] time[46] tag[methodToMeasure.normal]
然而既然要保存這些性能數(shù)據(jù)以供后期分析就不能把他們打印在System.err中,perf4j采用各種日志框架將這些性能信息打印在日志文件中,因而它提供了多種日志框架的實現(xiàn):Slf4JStopWatch、Log4JStopWatch、JavaLogStopWatch、CommonsLogStopWatch。在所有這些StopWatch的實現(xiàn)中,它們只是將原本打印在System.err中的性能日志打印到Logger(Log)中,我們可以使用: setNormalPriority(int normalPriority)
setExceptionPriority(int exceptionPriority)
來設置在打印性能日志時使用的Log Level(Priority)。默認使用的Logger Name:org.perf4j.TimingLogger,正常Level:INFO,異常Level:WARN。
如果將上述的LoggingStopWatch換成Slf4JStopWatch,并且配置相應的Log4J配置文件,則有如下輸出: //output:
// 150418 19:12:21,764 [INFO ] [main] o.p.TimingLogger - start[1429355541719] time[44] tag[methodToMeasure.normal]
// 150418 19:12:21,812 [WARN ] [main] o.p.TimingLogger - start[1429355541765] time[47] tag[methodToMeasureException.normal]
// java.lang.Exception: test
// at lev-in.learn.perf4j.SimplePerfCollector.main(SimplePerfCollector.java:17)
性能數(shù)據(jù)收集AOP
上一節(jié)中的性能數(shù)據(jù)收集雖然比較簡單,但是需要手動的向代碼中添加很多代碼,侵入性比較大,一旦某天因為各種原因需要將它們移除會有很大的代碼改動,另外對那些沒有源碼的方法來說無法添加這些代碼,因而perf4j提供了AOP方式的性能收集方式。perf4j采用AspectJ庫實現(xiàn)AOP,AspectJ支持運行時和編譯時的AOP織入(weaver),perf4j同時支持這兩種方式。另外perf4j還支持Spring中代理方式的AOP。
在perf4j目前只實現(xiàn)了注解方式的AOP織入,因而對所有想要打印性能數(shù)據(jù)的方法需要添加@Profiled注解,它可以用于方法或構造函數(shù)之上:@Retention(RetentionPolicy.RUNTIME)
@Target({ElementType.METHOD, ElementType.CONSTRUCTOR})
public @interface Profiled {
String message() default "";
String level() default "INFO";
boolean el() default true;
boolean logFailuresSeparately() default false;
long timeThreshold() default 0;
boolean normalAndSlowSuffixesEnabled() default false;
}
@Profiled注解除了支持所有XXStopWatch的所有屬性外,它還支持區(qū)分方法執(zhí)行成功還是拋出異常(logFailuresSeparately, <tag>.success, <tag>.failure)以及對tag和message值的EL(Expression Language,Apache Commons JEXL語法)解析,且默認該解析為ON。這里的EL可以作用于方法的參數(shù)($0, $1, $2…)、調(diào)用該方法的類($this,靜態(tài)方法該值為null)、方法的返回值($return,方法返回void或拋異常時該值為null)、方法拋出的異常($exception,方法正常返回時該值為null)。如文檔中的例子: @Profiled(tag = "servlet{$this.servletName}_{$0.pathInfo}")
有了@Profiled注解的方法以后,在運行時加載或編譯時,AspectJ會根據(jù)perf4j中實現(xiàn)的TimingAspect將性能收集代碼織入。perf4j不同包中定義的TimingAspect只是一個工廠類的角色,它用于創(chuàng)建相應功能的XXStopWatch,而主要實現(xiàn)在AbstractTimingAspect中。該類定義了一個@Around類型的PointCut,它作用與所有帶@Profiled注解的方法,并傳入ProceedingJointPoint和@Profiled參數(shù): @Around(value = "execution(* *(..)) && @annotation(profiled)", argNames = "pjp,profiled")
該PointCut的實現(xiàn)使用子工廠類創(chuàng)建相應的XXStopWatch實力,然后調(diào)用AgnosticTimingAspect的runProfiledMethod,該方法的實現(xiàn)也比較簡單:在方法調(diào)用前配置StopWatch實力,方法調(diào)用結束后根據(jù)方法參數(shù)、返回值、拋出的異常使用Apache Commons JEXL語法解析出tag和message,然后調(diào)用StopWatch的stop方法(內(nèi)部自動使用當前的Log框架輸出log日志)。
然而有了這些@Profiled注解的方法以后,如何將TimingAspect織入這些方法中呢?首先從運行時動態(tài)加載說起:運行時織入首先在項目的META-INF目錄中添加aop.xml文件,內(nèi)容為(官方文檔中AspectJ的版本為1.6.1,我在使用這個版本時不識別profiled注解,然后如果使用1.7.x以后的辦班,綠色那個配置是必須的,不然會出現(xiàn)NoSuchMethod的錯:java.lang.NoSuchMethodError: org.perf4j.log4j.aop.TimingAspect.aspectOf()Lorg/perf4j/log4j/aop/TimingAspect; 黃色部分用于調(diào)試,在實際運行時可以去除,不然會有一些干擾性的輸出。): <!DOCTYPE aspectj PUBLIC "-//AspectJ//DTD//EN" "http://www.eclipse.org/aspectj/dtd/aspectj.dtd">
<aspectj>
<aspects>
<aspect name="org.perf4j.log4j.aop.TimingAspect"/>
</aspects>
<weaver options="-verbose -showWeaveInfo">
<!-- Remember to include this-->
<include within="org.perf4j.log4j.aop.TimingAspect" />
<include within="levin.learn.perf4j.*" />
</weaver>
</aspectj>
并且在運行時要配置-javaagent參數(shù):-javaagent:libs/aspectjweaver-1.8.5.jar以實現(xiàn)類加載時動態(tài)織入。
對編譯時織入比較簡單,你只需要perf4j-0.9.16-log4jonly.jar而不是perf4j-0.9.16.jar,否則你的類會被織入多個Aspect;然后使用AspectJ編譯器(ajc)編譯即可,在編譯時需要aspectjrt.jar包依賴。對于maven編譯可以使用aspectj-maven-plugin:<plugin>
<groupId>org.codehaus.mojo</groupId>
<artifactId>aspectj-maven-plugin</artifactId>
<version>1.7</version>
<configuration>
<complianceLevel>1.7</complianceLevel>
<showWeaveInfo>true</showWeaveInfo>
<verbose>true</verbose>
<weaveDependencies>
<dependency>
<groupId>org.perf4j</groupId>
<artifactId>perf4j</artifactId>
<classifier>slf4jonly</classifier>
</dependency>
</weaveDependencies>
</configuration>
<dependencies>
<dependency>
<groupId>org.aspectj</groupId>
<artifactId>aspectjtools</artifactId>
<version>${aspectj.version}</version>
</dependency>
</dependencies>
<executions>
<execution>
<goals>
<goal>compile</goal><!-- use this goal to weave all your main classes -->
<goal>test-compile</goal><!-- use this goal to weave all your test classes -->
</goals>
</execution>
</executions>
</plugin>
對于Spring的Proxy方式AOP織入屬于比較常見的用法,這里不再贅述,可以參考官網(wǎng)的文檔,應該可以用。
性能數(shù)據(jù)分析
在使用perf4j收集到性能數(shù)據(jù)后,接下來就要對這些數(shù)據(jù)進行分析,不然這些數(shù)據(jù)本身并沒有多少用處。perf4j提供了一個簡單的分析類LogParser來做這個工作。可以使用命令行方式對日至文件分析:
java -jar /Users/dinglevin/.m2/repository/org/perf4j/perf4j/0.9.16/perf4j-0.9.16.jar -t 300000 perf4j-sample.log
輸出結果(-t 300000表示每5分鐘統(tǒng)計一次):
Tag Avg(ms) Min Max Std Dev Count
dynamicTag_iIsEven 513.4 23 957 236.3 24
dynamicTag_iIsOdd 552.3 100 937 272.4 24
failuresSeparatelyExample.failure 635.8 138 946 222.7 23
failuresSeparatelyExample.success 433.8 21 903 271.4 24
loggerExample 487.0 25 957 293.3 47
messageExample 746.9 34 1912 500.9 47
simpleBlock 467.7 14 951 307.9 48
simpleExample 533.0 1 995 306.1 48
或者使用tail命令實時分析:
tail -f perf4j-sample.log | java -jar /Users/dinglevin/.m2/repository/org/perf4j/perf4j/0.9.16/perf4j-0.9.16.jar
LogParser的具體使用方法如它自己所描述: Usage: LogParser [-o|--out|--output outputFile] [-g|--graph graphingOutput-File] [-t|--timeslice timeslice] [-r] [-f|--format text|csv] [logInputFile]
Arguments:
logInputFile - The log file to be parsed. If not specified, log data is read from stdin.
-o|--out|--output outputFile - The file where generated statistics should be written. If not specified, statistics are written to stdout.
-g|--graph graphingOutputFile - The file where generated perf graphs should be written. If not specified, no graphs are written.
-t|--timeslice timeslice - The length of time (in ms) of each timeslice for which statistics should be generated. Defaults to 30000 ms.
-r - Whether or not statistics rollups should be generated. If not specified, rollups are not generated.
-f|--format text|csv - The format for the statistics output, either plain text or CSV. Defaults to text.
If format is csv, then the columns output are tag, start, stop, mean, min, max, stddev, and count.
Note that out, stdout, err and stderr can be used as aliases to the standard output streams when specifying output files.
這里的圖片輸出采用Google Chart API,該API使用URL將數(shù)據(jù)上傳給Google服務器,然后Google會將它們轉(zhuǎn)換成PNG圖片返回,但是大家都懂的Google已經(jīng)被天朝封了,因而這個功能沒法使用(不知道會不會有足夠的時間,不然打算使用jung實現(xiàn)一個類似的功能),不想周末去公司,因而貼一張來自官網(wǎng)的結果圖: 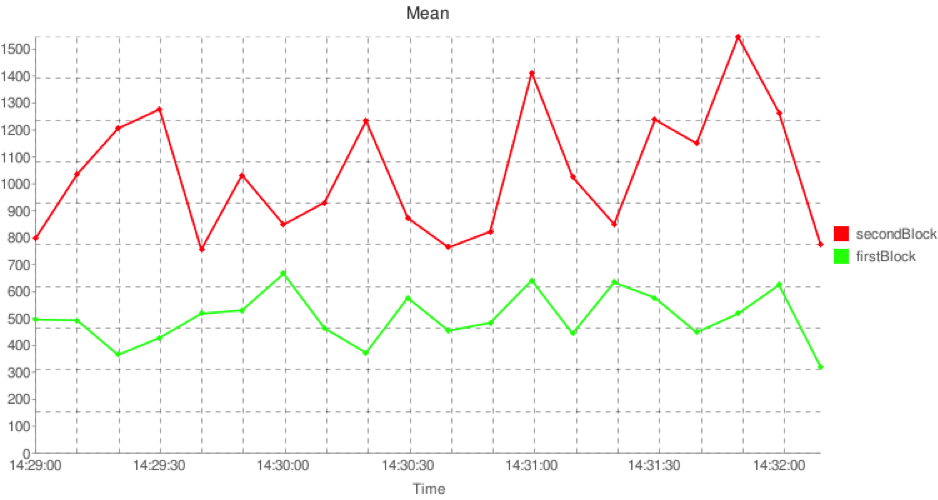
對Google Chart API有興趣的可以閱讀這里:http://www.haijd.net/archive/computer/google/google_chart_api/api.html。
在LogParser的實現(xiàn)中,LogParser類本身主要用于解析傳入的參數(shù),然后使用parseLog()方法處理所有邏輯,在該方法中它將日志文件的解析代理給StopWatchLogIterator類,該Iterator使用StopWatchParser解析每一行日志,它只是簡單的采用正則表達式匹配性能日志(start\\[(\\d+)\\] time\\[(\\d+)\\] tag\\[(.*?)\\](?: message\\[(.*?)\\])?);將相同tag的性能日志組合代理給GroupingStatisticsIterator,該Iterator生成給定時間間隔內(nèi)的tag到TimingStatistcs的Map,其中TimingStatistics紀錄了該時間間隔內(nèi)時間消耗的最小值、最大值、平均值、標準方差等;將輸出格式代理給GroupedTimingStatisticsFormatter,它支持text和csv兩種格式;最后將Chart輸出代理給StatisticsChartGenerator,默認實現(xiàn)采用GoogleStatisticsChartGenerator。
Log4J實時性能數(shù)據(jù)分析
perf4j還提供了幾個Log4J的Appender實現(xiàn)用于實時的性能數(shù)據(jù)分析,可以輸出txt、csv、png等格式的分析數(shù)據(jù):AsyncCoalescingStatisticsAppender,它主要用于配置實時統(tǒng)計時使用的參數(shù),如timeSlice、createRollupStatistics、downStreamLogLevel、queueSize等,以及內(nèi)部實際Appender,并且提供了StatisticsCsvLayout類以輸出csv格式的文件。這里之所以要用Async方式是為了減少該Appender對實際性能的影響,該Appender只是做一些簡單的檢查,然后將消息添加到內(nèi)部Queue中,由一個Daemon線程處理這個Queue并做統(tǒng)計信息。<!-- Perf4J appenders -->
<!--
This AsyncCoalescingStatisticsAppender groups StopWatch log messages
into GroupedTimingStatistics messages which it sends on the
file appender defined below
-->
<appender name="CoalescingStatistics"
class="org.perf4j.log4j.AsyncCoalescingStatisticsAppender">
<!--
The TimeSlice option is used to determine the time window for which
all received StopWatch logs are aggregated to create a single
GroupedTimingStatistics log. Here we set it to 10 seconds, overrid-ing
the default of 30000 ms
-->
<param name="TimeSlice" value="10000"/>
<appender-ref ref="fileAppender"/>
</appender>
<!-- This file appender is used to output aggregated performance statis-tics -->
<appender name="fileAppender" class="org.apache.log4j.FileAppender">
<param name="File" value="logs/perfStats.log"/>
<layout class="org.perf4j.log4j.StatisticsCsvLayout">
<param name="Columns" value="tag,start,stop,mean,count,tps"/>
</layout>
</appender>
<!-- Loggers -->
<!--
The Perf4J logger. Note that org.perf4j.TimingLogger is the value of the
org.perf4j.StopWatch.DEFAULT_LOGGER_NAME constant. Also, note that
additivity is set to false, which is usually what is desired - this means
that timing statements will only be sent to this logger and NOT to
upstream loggers.
-->
<logger name="org.perf4j.TimingLogger" additivity="false">
<level value="INFO"/>
<appender-ref ref="CoalescingStatistics"/>
</logger>
也可以向AsyncCoalescingStatisticsAppender添加GraphingStatisticsAppender以實現(xiàn)Google Chart方式的輸出,GraphingStatisticsAppender用于生成Google Chart API格式的數(shù)據(jù),而實際輸出由內(nèi)部包含的Appender決定:
<!--
This first GraphingStatisticsAppender graphs Mean execution times for the
firstBlock and secondBlock tags
-->
<appender name="graphExecutionTimes"
class="org.perf4j.log4j.GraphingStatisticsAppender">
<!-- Possible GraphTypes are Mean, Min, Max, StdDev, Count and TPS -->
<param name="GraphType" value="Mean"/>
<!-- The tags of the timed execution blocks to graph are specified here -->
<param name="TagNamesToGraph" value="firstBlock,secondBlock"/>
<appender-ref ref="graphsFileAppender"/>
</appender>
<!--
This second GraphingStatisticsAppender graphs transactions per second
for the firstBlock and secondBlock tags
-->
<appender name="graphExecutionTPS"
class="org.perf4j.log4j.GraphingStatisticsAppender">
<param name="GraphType" value="TPS"/>
<param name="TagNamesToGraph" value="firstBlock,secondBlock"/>
<appender-ref ref="graphsFileAppender"/>
</appender>
<!--
This file appender is used to output the graph URLs generated
by the GraphingStatisticsAppenders
-->
<appender name="graphsFileAppender" class="org.apache.log4j.FileAppender">
<param name="File" value="logs/perfGraphs.log"/>
<layout class="org.apache.log4j.PatternLayout">
<param name="ConversionPattern" value="%m%n"/>
</layout>
</appender>
所有定義的GraphingStatisticsAppender可以通過暴露GraphingServlet獲取信息。
最后perf4j還提供JMX方式的性能統(tǒng)計數(shù)據(jù)處理與獲取,首先在AsyncCoalescingStatisticsAppender中定義一個JmxAttributeStatisticsAppender,該Appender注冊StatisticsExposingMBean,并實時更新該MBean性能統(tǒng)計數(shù)據(jù)以供其他管理程序查詢或設置閥值而主動發(fā)送JMX Notification。JMX的Notification機制好像用的不多,因而不再詳述。
參考
1. perf4j源碼(0.9.16)
2. http://perf4j.codehaus.org/devguide.html#Perf4J_Developer_Guide
3. http://www.infoq.com/articles/perf4j#.VTHH4dZ8WVc.sinaweibo
部分事例代碼可以從這里找到:
https://github.com/dinglevin/levin-learn/tree/master/levin-learn-perf4j
posted on 2015-04-19 13:35
DLevin 閱讀(7804)
評論(1) 編輯 收藏 所屬分類:
深入源碼