[標(biāo)題]:[原]Struts2-整合JFreeChart
[時(shí)間]:2009-9-3
[摘要]:JFreeChart
[關(guān)鍵字]:浪曦視頻,Struts2應(yīng)用開(kāi)發(fā)系列,WebWork,Apache
[環(huán)境]:struts-2.1.6、JDK6、MyEclipse7、Tomcat6
[作者]:Winty (wintys@gmail.com) http://www.tkk7.com/wintys
[正文]:
1、JFreeChart入門(mén)
JFreeChart網(wǎng)站:www.jfree.org。需要下載jfreechart和jcommon(JFreeChart依賴于jcommon)。JCommon的文檔和源代碼需要單獨(dú)下載。使用時(shí)將jfreechart.jar和jcommon.jar加到構(gòu)建路徑中。
a. 餅圖(Swing)
/StrutsHelloWorld/src/wintys/jfreechart/PieChart.java:
package wintys.jfreechart;
import java.awt.Font;
import org.jfree.chart.ChartFactory;
import org.jfree.chart.ChartFrame;
import org.jfree.chart.JFreeChart;
import org.jfree.chart.plot.PiePlot;
import org.jfree.data.general.DefaultPieDataset;
/**
* 餅狀圖
* @author Winty (wintys@gmail.com)
* @version 2009-8-31
* @see http://wintys.blogjava.net
*/
public class PieChart {
public static void main(String[] args) {
ChartFrame frame = new ChartFrame("My JFreeChart Demo",getChart());
frame.setVisible(true);
frame.setSize(600 , 400);
}
public static JFreeChart getChart(){
DefaultPieDataset dpd = new DefaultPieDataset();
dpd.setValue("計(jì)算機(jī)", 200);
dpd.setValue("電子", 150);
dpd.setValue("經(jīng)管", 50);
dpd.setValue("外語(yǔ)", 198);
JFreeChart chart
// = ChartFactory.createPieChart("院系人數(shù)", dpd, true, true,false);
= ChartFactory.createPieChart3D("院系人數(shù)", dpd, true, true,true);
//需要設(shè)置字體,否則中文無(wú)法顯示
Font font = new Font("宋體" , Font.PLAIN , 20);
chart.getTitle().setFont(font);
chart.getLegend().setItemFont(font);
PiePlot piePlot = (PiePlot)chart.getPlot();
piePlot.setLabelFont(font);
return chart;
}
}
b. 柱狀圖(Swing)
/StrutsHelloWorld/src/wintys/jfreechart/BarChart.java:
package wintys.jfreechart;
import java.awt.Font;
import javax.swing.JPanel;
import org.jfree.chart.ChartFactory;
import org.jfree.chart.ChartPanel;
import org.jfree.chart.JFreeChart;
import org.jfree.chart.axis.CategoryAxis;
import org.jfree.chart.axis.CategoryLabelPositions;
import org.jfree.chart.axis.ValueAxis;
import org.jfree.chart.plot.CategoryPlot;
import org.jfree.chart.plot.PlotOrientation;
import org.jfree.chart.title.TextTitle;
import org.jfree.data.category.CategoryDataset;
import org.jfree.data.category.DefaultCategoryDataset;
import org.jfree.ui.ApplicationFrame;
/**
* 柱狀圖
*
* @author Winty (wintys@gmail.com)
* @version 2009-8-31
* @see http://wintys.blogjava.net
*/
@SuppressWarnings("serial")
public class BarChart extends ApplicationFrame {
public BarChart(String title) {
super(title);
setContentPane(createPanel());
setSize(800, 600);
setVisible(true);
}
public static void main(String[] args) {
new BarChart("水果產(chǎn)量圖");
}
private static CategoryDataset createDataset() {
DefaultCategoryDataset dcd = new DefaultCategoryDataset();
dcd.addValue(100, "北京", "蘋(píng)果");
dcd.addValue(70, "上海", "蘋(píng)果");
dcd.addValue(120, "廣州", "蘋(píng)果");
dcd.addValue(220, "北京", "梨子");
dcd.addValue(260, "上海", "梨子");
dcd.addValue(300, "廣州", "梨子");
dcd.addValue(320, "北京", "葡萄");
dcd.addValue(370, "上海", "葡萄");
dcd.addValue(320, "廣州", "葡萄");
dcd.addValue(490, "北京", "香蕉");
dcd.addValue(450, "上海", "香蕉");
dcd.addValue(400, "廣州", "香蕉");
dcd.addValue(200, "北京", "荔枝");
dcd.addValue(230, "上海", "荔枝");
dcd.addValue(340, "廣州", "荔枝");
return dcd;
}
/**
* default getChart() method using default dataset
* @return
*/
public static JFreeChart getChart() {
return getChart(createDataset());
}
public static JFreeChart getChart(CategoryDataset cd){
JFreeChart chart = ChartFactory.createBarChart3D("", "水果", "產(chǎn)量", cd,
PlotOrientation.VERTICAL, true, true, false);
/*不設(shè)置字體,漢字會(huì)亂碼*/
Font font = new Font("宋體", Font.BOLD, 20);
chart.setTitle(new TextTitle("水果產(chǎn)量圖", font));
chart.getTitle().setFont(font);
chart.getLegend().setItemFont(font);
CategoryPlot plot = (CategoryPlot) chart.getPlot();
CategoryAxis categoryAxis = plot.getDomainAxis();
categoryAxis.setLabelFont(font);
categoryAxis.setTickLabelFont(font);
ValueAxis valueAxis = plot.getRangeAxis();
valueAxis.setLabelFont(font);
categoryAxis.setCategoryLabelPositions(CategoryLabelPositions.UP_45);
return chart;
}
private JPanel createPanel() {
return new ChartPanel(getChart());
}
}
c. 輸出圖片
/StrutsHelloWorld/src/wintys/jfreechart/OutputChart.java:
package wintys.jfreechart;
import java.io.File;
import java.io.IOException;
import org.jfree.chart.ChartUtilities;
import org.jfree.chart.JFreeChart;
/**
* 將JFreeChart圖片輸出到文件
* @author Winty (wintys@gmail.com)
* @version 2009-9-1
* @see http://wintys.blogjava.net
*/
public class OutputChart {
public static void main(String[] args) {
File file = new File("D:/temp.jpg");
JFreeChart chart = BarChart.getChart();
final int width = 400;
final int height = 400;
try {
ChartUtilities.saveChartAsJPEG(file, chart, width, height);
} catch (IOException e) {
e.printStackTrace();
}
}
}
d. 在Servlet中使用JFreeChart
ServletUtilities.saveChartAsPNG();//生成文件在Tomcat temp下
/StrutsHelloWorld/src/wintys/jfreechart/DisplayChartServlet.java:
package wintys.jfreechart;
import java.io.IOException;
import javax.servlet.ServletException;
import javax.servlet.http.HttpServlet;
import javax.servlet.http.HttpServletRequest;
import javax.servlet.http.HttpServletResponse;
import org.jfree.chart.ChartUtilities;
import org.jfree.chart.JFreeChart;
@SuppressWarnings("serial")
public class DisplayChartServlet extends HttpServlet {
public void doGet(HttpServletRequest request, HttpServletResponse response)
throws ServletException, IOException {
JFreeChart chart;
int width;
int height;
String type = request.getParameter("type");
if ("pie".equalsIgnoreCase(type)) {
chart = PieChart.getChart();// pie
width = 600;
height = 400;
} else {
chart = BarChart.getChart();// bar
width = 800;
height = 600;
}
response.setContentType("image/png");
ChartUtilities.writeChartAsPNG(response.getOutputStream(), chart,
width, height);
/*
//存為臨時(shí)圖片,然后輸出
String image = ServletUtilities.saveChartAsPNG(chart,600, 400, request.getSession());
ServletUtilities.sendTempFile(image, response);
System.out.println("Image:" + image);
System.out.println(System.getProperty("java.io.tmpdir"));
*/
}
public void doPost(HttpServletRequest request, HttpServletResponse response)
throws ServletException, IOException {
doGet(request, response);
}
}
web.xml中的配置:
<servlet>
<servlet-name>DisplayChartServlet</servlet-name>
<servlet-class>wintys.jfreechart.DisplayChartServlet</servlet-class>
</servlet>
<servlet-mapping>
<servlet-name>DisplayChartServlet</servlet-name>
<url-pattern>/jfreechart/DisplayChartServlet</url-pattern>
</servlet-mapping>
/StrutsHelloWorld/WebRoot/jfreechart/JFreeChartDisplayChart.jsp:
<%@ page language="java" import="java.util.*" pageEncoding="GB18030"%>
<!DOCTYPE HTML PUBLIC "-//W3C//DTD HTML 4.01 Transitional//EN">
<html>
<head>
<title></title>
</head>
<body>
這是JFreeChart生成的柱狀圖:
<br />
<img src="/StrutsHelloWorld/jfreechart/DisplayChartServlet?type=bar" />
<hr/>
<br />
這是餅圖:<br/>
<img src="/StrutsHelloWorld/jfreechart/DisplayChartServlet?type=pie" />
</body>
</html>
e. JFreeChart自帶的顯示圖形的Servlet:DisplayChart
org.jfree.chart.servlet.DisplayChart 與 以上編寫(xiě)的wintys.jfreechart.DisplayChartServlet原理相似。
在web.xml中的配置:
<servlet>
<servlet-name>JFreeChartDisplayChart</servlet-name>
<servlet-class>org.jfree.chart.servlet.DisplayChart</servlet-class>
</servlet>
<servlet-mapping>
<servlet-name>JFreeChartDisplayChart</servlet-name>
<url-pattern>/servlet/DisplayChart</url-pattern>
</servlet-mapping>
/StrutsHelloWorld/WebRoot/jfreechart/JFreeChartDisplayChart.jsp:
<%@ page language="java" import="java.util.*" pageEncoding="GB18030"%>
<%@ page import = "wintys.jfreechart.BarChart" %>
<%@ page import = "org.jfree.chart.JFreeChart" %>
<%@ page import = "org.jfree.chart.servlet.ServletUtilities" %>
<!DOCTYPE HTML PUBLIC "-//W3C//DTD HTML 4.01 Transitional//EN">
<html>
<head>
<title></title>
</head>
<body>
org.jfree.chart.servlet.DisplayChart使用:
<br />
<%
JFreeChart chart = BarChart.getChart();
String filename = ServletUtilities.saveChartAsPNG(chart , 800 , 600 , session);
String url = request.getContextPath();
String imageurl = url + "/servlet/DisplayChart?filename=" + filename;
%>
<img src="<%=imageurl%>" />
</body>
</html>
2、Struts2整合JFreeChart
在Struts2中整合JFreeChart需要把struts中的JFreeChart Plugin.jar復(fù)制到構(gòu)建路徑中。其實(shí)JFreeChart Plugin只是提供了一個(gè)org.apache.struts2.dispatcher.ChartResult,用于在Struts中方便地顯示圖形。
/StrutsHelloWorld/WebRoot/jfreechart/StrutsJFreeChart.jsp:
<%@ page language="java" import="java.util.*" pageEncoding="GB18030"%>
<%@taglib uri="/struts-tags" prefix="s"%>
<!DOCTYPE HTML PUBLIC "-//W3C//DTD HTML 4.01 Transitional//EN">
<html>
<head>
<title></title>
</head>
<body>
<s:form action="jfreechart" namespace="/mystruts">
<s:checkbox name="interests" fieldValue="football" label="足球" labelposition="left"/>
<s:checkbox name="interests" fieldValue="basketball" label="籃球"/>
<s:checkbox name="interests" fieldValue="baseball" label="棒球" />
<s:submit name="submit" value="提交"></s:submit>
</s:form>
<img alt="" src="/StrutsHelloWorld/mystruts/jfreechart.action" />
</body>
</html>
注意:
a). <s:checkbox />中應(yīng)該使用fieldValue屬性而不是value作為值。
b). 還可應(yīng)用如下方法添加checkbox: <s:checkboxlist list="#{'value' : 'label' , "math":"數(shù)學(xué)"} "/>
struts.xml配置:
<struts>
......
<include file="struts-myjfreechart.xml" />
......
</struts>
struts-myjfreechart.xml:
<?xml version="1.0" encoding="UTF-8" ?>
<!DOCTYPE struts PUBLIC
"-//Apache Software Foundation//DTD Struts Configuration 2.0//EN"
"http://struts.apache.org/dtds/struts-2.0.dtd">
<struts>
<package name="MyStrutsJFreeChart" extends="jfreechart-default" namespace="/mystruts">
<action name="jfreechart" class="wintys.jfreechart.ChartAction">
<result name="success" type="chart">
<param name="width">800</param>
<param name="height">600</param>
</result>
</action>
</package>
</struts>
/StrutsHelloWorld/src/wintys/jfreechart/ChartAction.java:
package wintys.jfreechart;
import java.awt.Font;
import java.util.Iterator;
import java.util.List;
import java.util.Map;
import org.jfree.chart.ChartFactory;
import org.jfree.chart.JFreeChart;
import org.jfree.chart.axis.CategoryAxis;
import org.jfree.chart.axis.CategoryLabelPositions;
import org.jfree.chart.axis.ValueAxis;
import org.jfree.chart.plot.CategoryPlot;
import org.jfree.chart.plot.PlotOrientation;
import org.jfree.chart.title.TextTitle;
import org.jfree.data.category.CategoryDataset;
import org.jfree.data.category.DefaultCategoryDataset;
import com.opensymphony.xwork2.ActionContext;
import com.opensymphony.xwork2.ActionSupport;
/**
* JFreeChart Struts Plugin
* @author Winty (wintys@gmail.com)
* @version 2009-9-2
* @see http://wintys.blogjava.net
*/
@SuppressWarnings("serial")
public class ChartAction extends ActionSupport {
private List<String> interests;
public List<String> getInterests() {
return interests;
}
public void setInterests(List<String> interests) {
this.interests = interests;
}
/**
* 記錄interest信息
*/
private void addInterests(){
ActionContext context = ActionContext.getContext();
Map<String , Object> application = context.getApplication();
if(interests == null)return;
Iterator<String> it = interests.iterator();
while(it.hasNext()){
String interest = it.next();
addValue(application , interest);
}
}
/**
* 在application中保存數(shù)據(jù)
*/
private void addValue(Map<String , Object> application , String key){
if(key == null)
return;
int value = getValue(application , key) + 1;
application.put(key, value);
}
/**
* 從application中獲取數(shù)據(jù)。如果key不存在,則返回0。
*/
private int getValue(Map<String , Object> application , String key){
int value = 0;
Object obj = application.get(key);
if( obj != null){
value = ((Integer)obj).intValue();
}
return value;
}
/**
* for JFreeChart
* @return org.jfree.chart.JFreeChart
*/
public JFreeChart getChart(){
JFreeChart chart = getChart(createDataset());
return chart;
}
private CategoryDataset createDataset(){
ActionContext context = ActionContext.getContext();
Map<String , Object> application = context.getApplication();
DefaultCategoryDataset dcd = new DefaultCategoryDataset();
dcd.addValue(getValue(application , "football"), "" , "足球");
dcd.addValue(getValue(application , "basketball"), "" , "籃球");
dcd.addValue(getValue(application , "baseball"), "" , "棒球");
return dcd;
}
private static JFreeChart getChart(CategoryDataset cd){
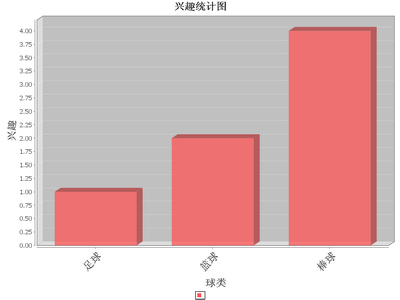
JFreeChart chart = ChartFactory.createBarChart3D("", "球類", "興趣", cd,
PlotOrientation.VERTICAL, true, true, false);
/*不設(shè)置字體,漢字會(huì)亂碼*/
Font font = new Font("宋體", Font.BOLD, 20);
chart.setTitle(new TextTitle("興趣統(tǒng)計(jì)圖", font));
chart.getTitle().setFont(font);
chart.getLegend().setItemFont(font);
CategoryPlot plot = (CategoryPlot) chart.getPlot();
CategoryAxis categoryAxis = plot.getDomainAxis();
categoryAxis.setLabelFont(font);
categoryAxis.setTickLabelFont(font);
ValueAxis valueAxis = plot.getRangeAxis();
valueAxis.setLabelFont(font);
categoryAxis.setCategoryLabelPositions(CategoryLabelPositions.UP_45);
return chart;
}
@Override
public String execute() throws Exception {
addInterests();//統(tǒng)計(jì)interest數(shù)據(jù)
return SUCCESS;
}
}
結(jié)果:
[參考資料]:
[1]《浪曦視頻之Struts2應(yīng)用開(kāi)發(fā)系列》
[2] struts2整合jfreechart : http://zyongking.javaeye.com/blog/443980
[3] Struts JFreeChart Plugin :
http://struts.apache.org/2.x/docs/jfreechart-plugin.html
[附件]:
源代碼 :
http://www.tkk7.com/Files/wintys/StrutsHelloWorld_jfreechart.zip
posted on 2009-09-03 17:10
天堂露珠 閱讀(2468)
評(píng)論(0) 編輯 收藏 所屬分類:
Struts