Common Problems in Java SE Application
This message is based on the following materials.
http://java.sun.com/developer/technicalArticles/J2SE/monitoring/#Insufficient_Memory
http://java.sun.com/developer/technicalArticles/javase/troubleshoot//
1. Java Memory Basic
1.1 Heap, Non-Heap, and Native
Heap memory is the runtime data area from which memory for all class instances and arrays is allocated.
Non-heap memory includes the method area and memory required for the internal processing or optimization of the JVM.
It stores per-class structures such as a runtime constant pool, field and method data, and the code for methods and constructors.
Native memory is the virtual memory managed by the operating system. When the memory is insufficient for an application to allocate, a java.lang.OutOfMemoryError will be thrown.
1.2 GC and Full GC
The garbage collector (GC) detects garbage, defined as objects that are
no longer reachable, then reclaims it and makes space available to the
running program. The GC typically works in a stop-the-world fashion --
that is, it freezes the heap when working.
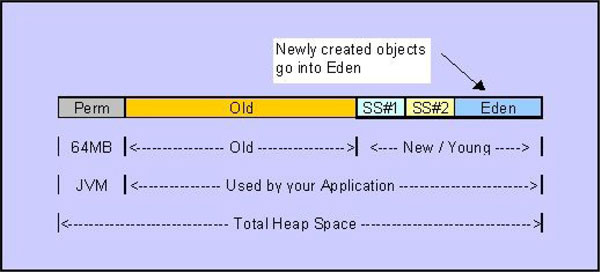
The above diagram describes the layout of HotSpot VM Heap and it consists of three parts: perm generation, old generation and new/yang generation. The perm generation is basically for class loading. Next are the old and young generation. The young generation is further broken up into three spaces: Eden, Survivor Space 1 (SS#1) and Survivor Space 2 (SS#2).
2. Memory Problems: out of memory, memory leak and Frequently full GC
- java.lang.OutOfMemoryError: Java heap space => It indicates that an object could not be allocated in the Java heap.
-
Configuration issue, where the specified heap size (or the default size, if not specified) is insufficient for the application.
-
The application is unintentionally holding references to objects, and this prevents the objects from being garbage collected. This is the Java language equivalent of a memory leak.
-
One other potential source of OutOfMemoryError arises with applications that make excessive use of finalizers.
- java.lang.OutOfMemoryError: PermGen space => the permanent generation is full.
- If an application loads a very large number of classes, then the size of the permanent generation might need to be increased using the -XX:MaxPermSize option.
- Interned java.lang.String objects are also stored in the permanent generation.If an application interns a huge number of strings, the permanent generation might need to be increased from its default setting.
- java.lang.OutOfMemoryError: Requested array size exceeds VM limit
attempted to allocate an array that is larger than the heap size
- java.lang.OutOfMemoryError: request <size> bytes for <reason>. Out of swap space?
The Java Native Interface (JNI) code or the native library of an application and the JVM implementation allocate memory from the native heap. An OutOfMemoryError will be thrown when an allocation in the native heap fails.
- java.lang.OutOfMemoryError: <reason> <stack trace> (Native method)
an indication that a native method has encountered an allocation failure. The difference between this and the previous message is that the allocation failure was detected in a JNI or native method rather than in Java VM code.
3. Thread Problems: dead lock, infinite loop and high lock contention
- Dead Lock
- block by object monitor: Each object is associated with a monitor. If a thread invokes a synchronized method on an object, that object is locked.
- block by java.util.concurrent.locks
- Looping Thread
If thread CPU time is continuously increasing, but it is not unresponsive. An infinite loop may consume all available CPU cycles and cause the rest of the application to be unresponsive.
- High Lock Contention
Synchronization is heavily used in multithreaded applications to ensure mutually exclusive access to a shared resource or to coordinate and complete tasks among multiple threads.
Or too many threads are waiting for a limited resource.
Troubleshooting Tools in Java SE Application
1. Command line tools
|
NAME
|
Description
|
Target Problem
|
|
jstat
|
Java Virtual Machine Statistics Monitoring Tool
|
JVM memory statistics including memory usage,
garbage collection time, class loading, and the just-in-time compiler
statistics
|
|
jmap
|
Java Memory Map
|
It prints shared object memory maps or
heap memory details of a given process, core file, or remote debug server. It
offers an inclusive, detailed memory configuration and information on free
space capacity
|
|
jhat
|
Java Heap Analysis Tool
|
Parse a binary heap dump, launch a web
browser, and present standard queries.
|
|
jps
|
Java Virtual Machine Process Status Tool
|
The jps tool lists the instrumented HotSpot Java Virtual
Machines (JVMs) on the target system. In other words, it lists java
application and its process id.
|
|
jstack
|
Java Stack Trace
|
It provides the stack traces of all the threads
attached to a VM, such as application threads and interval VM threads. It
also performs deadlock detection and will perform a stack trace if the VM is
hung
|
|
HPROF
|
The Heap and CPU Profiling Agent
|
a heap-CPU profiling tool
that collects information on CPU usage, heap dumps, and thread states, uses
the JVM Tool Interface (JVMTI), so every JVM has a diagnostic interface
|
|
jinfo
|
Java Configuration Info
|
jinfo prints Java configuration information
for a given Java process or core file or a remote debug server. And it can
set java configuration property at runtime.
|
|
XX:+HeapDumpOnOutOfMemoryError
|
|
When an OutOfMemoryError is thrown, a heap dump file named
java_pid<pid>.hprof will be created automatically
|
2. Visual Tools
|
NAME
|
Description
|
Target Problem
|
|
jconsole
|
Launch a GUI to monitor and manage Java applications and
Java VMs on a local or remote machine.
|
Memory and Thread Problem
|
|
jvisualvm
|
Java Visual VM
|
Java VisualVM relies on tools such as jstat, jinfo,
jstack, and jmap to obtain detailed information about applications running
inside a JVM. It then presents the data in a unified, graphically rich
manner.
|
posted on 2009-01-08 22:15
Justin Chen 閱讀(3289)
評論(3) 編輯 收藏 所屬分類:
Inside JVM