import java.awt.Color;
import java.io.IOException;
import java.text.SimpleDateFormat;
import javax.servlet.ServletRequest;
import javax.servlet.ServletResponse;
import org.jfree.chart.ChartFactory;
import org.jfree.chart.ChartUtilities;
import org.jfree.chart.JFreeChart;
import org.jfree.chart.axis.DateAxis;
import org.jfree.chart.axis.DateTickUnit;
import org.jfree.chart.plot.PlotOrientation;
import org.jfree.chart.plot.XYPlot;
import org.jfree.data.time.Day;
import org.jfree.data.time.Hour;
import org.jfree.data.time.Month;
import org.jfree.data.time.TimeSeries;
import org.jfree.data.time.TimeSeriesCollection;
import org.jfree.data.xy.XYDataset;
import org.jfree.ui.RectangleInsets;
/**
* 用于將統計結果顯示成走勢圖
* @author lord
* 調用方法:
TrendChart trendChart = new TrendChart();
trendChart.chartTitle = "走勢圖";
trendChart.chartSeriesDesc = "走勢曲線";
trendChart.chartXdesc = "時間";
trendChart.chartYdesc = "價格";
trendChart.graphHigh = 400;
trendChart.graphWidth = 600;
trendChart.timeFormat = "yyyy-MM";
trendChart.periodType = TrendChart.DAY;
......
trendChart.addTimeSeriesUnitData(mYear, mMonth, mDay, mHour, (int)rData);
trendChart.createTrendGraphByServlet(request, response);
*/
public class TrendChart {
public final static String MONTH = "MONTH";
public final static String DAY = "DAY";
public final static String HOUR = "HOUR";
private JFreeChart rChart = null; //圖表對象
public String chartTitle = ""; //圖表標題
public String chartXdesc = ""; //X軸標題
public String chartYdesc = ""; //Y軸標題
public String chartSeriesDesc = ""; //曲線說明
public int graphWidth = 600; //默認寬度
public int graphHigh = 400; //默認高度
public String timeFormat = "MM/yyyy"; // 按日:MM-dd ,按小時:hh:mm
// 用于標志用戶選擇的是按哪種查詢統計周期類型(年、月、天、小時).
// 年:YEAR, 月:MONTH, 天:DAY, 小時:HOUR
public String periodType = "";
// 用于確定時間間隔
public int dateInterval = 0;
//統計結果數據集
TimeSeriesCollection statDataset = new TimeSeriesCollection();
TimeSeries monthSeries = null; //月份統計圖數據集合
TimeSeries daySeries = null; //天數統計圖數據集合
TimeSeries hourSeries = null; //小時統計圖數據集合
/**
* 創建Servlet方式走勢圖表
* @param req
* @param res
* @throws IOException
*/
public void createTrendGraphByServlet(ServletRequest req, ServletResponse res) throws IOException {
res.setContentType("image/jpeg");
setTimeSeriesStatType();
rChart = createTrendChart();
ChartUtilities.writeChartAsJPEG(res.getOutputStream(), 1, rChart, graphWidth, graphHigh, null);
}
/**
* 創建趨勢圖表
* @return JFreeChart 圖表對象JFreeChart
*/
private JFreeChart createTrendChart(){
JFreeChart _freeChart = ChartFactory.createTimeSeriesChart(chartTitle, chartXdesc, chartYdesc,
getTimeSeriesStatDataSet(), true, false, false);
_freeChart.setBackgroundPaint(Color.white);
XYPlot _xyplot = _freeChart.getXYPlot();
_xyplot.setOrientation(PlotOrientation.VERTICAL);
_xyplot.setBackgroundPaint(Color.lightGray);
_xyplot.setDomainGridlinePaint(Color.white);
_xyplot.setRangeGridlinePaint(Color.white);
_xyplot.setAxisOffset(new RectangleInsets(1.0, 2.0, 2.0, 10.0));
DateAxis dateaxis = (DateAxis) _xyplot.getDomainAxis();
if (periodType.equalsIgnoreCase("MONTH")){
if (dateInterval > 0) {
dateaxis.setTickUnit(new DateTickUnit(DateTickUnit.MONTH, dateInterval));
}
}else if (periodType.equalsIgnoreCase("DAY")){
if (dateInterval > 0) {
dateaxis.setTickUnit(new DateTickUnit(DateTickUnit.DAY, dateInterval));
}
}else if (periodType.equalsIgnoreCase("HOUR")){
if (dateInterval > 0) {
dateaxis.setTickUnit(new DateTickUnit(DateTickUnit.HOUR, dateInterval));
}
}
dateaxis.setDateFormatOverride(new SimpleDateFormat(timeFormat));
return _freeChart;
}
/**
* 增加走勢圖數據
* @param periodType 區間類型
* @param year 年份
* @param month 月份
* @param day 日期
* @param hour 時間
* @param statData 統計數據
*/
public void addTimeSeriesUnitData(int year, int month, int day, int hour, int statData) {
if (periodType.equalsIgnoreCase("MONTH")){
if (monthSeries == null){
monthSeries = new TimeSeries(chartSeriesDesc, Month.class);
}
monthSeries.add(new Month(month, year), statData);
}else if (periodType.equalsIgnoreCase("DAY")){
if (daySeries == null){
daySeries = new TimeSeries(chartSeriesDesc, Day.class);
}
daySeries.add(new Day(day, month, year), statData);
}else if (periodType.equalsIgnoreCase("HOUR")){
if (hourSeries == null){
hourSeries = new TimeSeries(chartSeriesDesc, Hour.class);
}
hourSeries.add(new Hour(hour, day, month, year), statData);
}
}
/**
* 設置走勢圖統計的區間類型
* @param periodType 區間類型
*/
private void setTimeSeriesStatType() {
if (periodType.equalsIgnoreCase("MONTH")){
statDataset.addSeries(monthSeries);
}else if (periodType.equalsIgnoreCase("DAY")){
statDataset.addSeries(daySeries);
}else if (periodType.equalsIgnoreCase("HOUR")){
statDataset.addSeries(hourSeries);
}
}
/**
* 獲得時序圖的統計數據
* @return XYDataset 統計數據
*/
private XYDataset getTimeSeriesStatDataSet() {
statDataset.setDomainIsPointsInTime(true);
return statDataset;
}
public int getDateInterval() {
return dateInterval;
}
public void setDateInterval(int dateInterval) {
this.dateInterval = dateInterval;
}
JSP調用代碼如下:
TrendChart trendChart = new TrendChart();
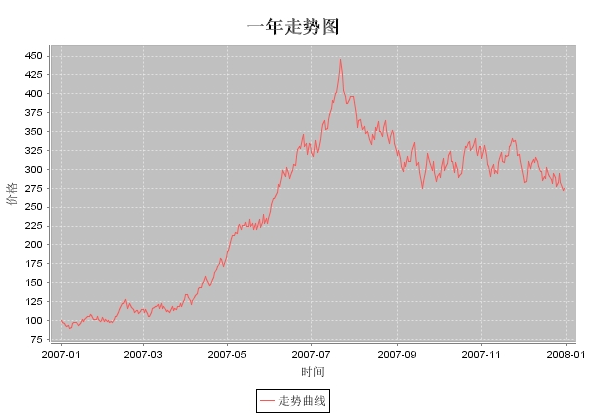
trendChart.chartTitle = "一年走勢圖";
trendChart.chartSeriesDesc = "走勢曲線";
trendChart.chartXdesc = "時間";
trendChart.chartYdesc = "價格";
trendChart.graphHigh = 400;
trendChart.graphWidth = 600;
trendChart.timeFormat = "yyyy-MM";
trendChart.periodType = TrendChart.DAY;
double baseData = 100.0;
double rData = baseData;
java.util.Calendar calendar = java.util.Calendar.getInstance();
calendar.set(2007, 0, 0);
for (int i = 1; i <= 365; i++){
rData = rData * (1 + (Math.random() - 0.495) / 10.0);
calendar.add(java.util.Calendar.DAY_OF_MONTH, 1);
System.out.println(calendar.get(java.util.Calendar.YEAR) + "||" +
(calendar.get(java.util.Calendar.MONTH) + 1) + "||" + calendar.get(java.util.Calendar.DAY_OF_MONTH) + "||" +
(calendar.get(java.util.Calendar.HOUR_OF_DAY) + "||" + calendar.get(java.util.Calendar.MINUTE))
);
int mYear = calendar.get(java.util.Calendar.YEAR);
int mMonth = calendar.get(java.util.Calendar.MONTH) + 1;
int mDay = calendar.get(java.util.Calendar.DAY_OF_MONTH);
int mHour = calendar.get(java.util.Calendar.HOUR_OF_DAY);
trendChart.addTimeSeriesUnitData(mYear, mMonth, mDay, mHour, (int)rData);
}
trendChart.createTrendGraphByServlet(request, response);
顯示圖結果如下:
posted on 2007-05-10 16:29
LORD BLOG 閱讀(4210)
評論(0) 編輯 收藏 所屬分類:
JAVA