1
 <! DOCTYPE html PUBLIC "-//W3C//DTD XHTML 1.0 Transitional//EN" "http://www.w3.org/TR/xhtml1/DTD/xhtml1-transitional.dtd" >
2 < html xmlns ="http://www.w3.org/1999/xhtml" >
3 < head >
4 < meta http-equiv ="Content-Type" content ="text/html; charset=utf-8" />
5 < title > TEST </ title >
6 < script type ="text/javascript" src ="wz_jsgraphics.js" ></ script >
7 < script type ="text/javascript" src ="line.js" ></ script >
8 </ head >
9 < body >
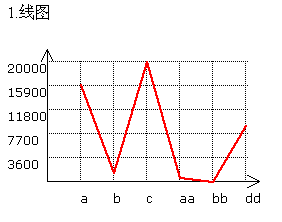
10 < p > 1.線圖 </ p >
11 < div id ="LineDiv" style ="position:relative;height:200px;width:300px;" ></ div >
12 
 < script language ="javascript" >
13  var y = new Array ();
14 y[ 0 ] = 16000 ;
15 y[ 1 ] = 1000 ;
16 y[ 2 ] = 20000 ;
17 y[ 3 ] = 100 ;
18 y[ 4 ] = - 500 ;
19 y[ 5 ] = 9000 ;
20 var x = new Array ();
21 x[ 0 ] = " a " ;
22 x[ 1 ] = " b " ;
23 x[ 2 ] = " c " ;
24 x[ 3 ] = " aa " ;
25 x[ 4 ] = " bb " ;
26 x[ 5 ] = " dd " ;
27 var myline = new Line( " LineDiv " );
28 myline.drawXYLine(y,x);
29  // myline.clearLine();
30 </ script >
31 </ body >
32 </ html >
效果圖:
1 /**/ /* ************更多技術文章請訪問:http://www.tkk7.com/JAVA-HE****************
2 *
3 * 文件名:line.js V 1.01
4 *
5 * 作 者:何昌敏
6 *
7 * 時 間:2007-7
8 *
9 * 描 述:繪制坐標曲線圖
10 *
11 * 備 注:
12 * 1.實現了根據所提供數據,自動標刻y軸坐標。
13 * 2.實現了圖像清除。
14 * 3.調整startx starty能實現整體位置調整。
15 *
16 * 感 謝:Walter Zorn提供了API ——wz_jsgraphics.js v. 3.01。
17 *
18 *************更多技術文章請訪問:http://www.tkk7.com/JAVA-HE*************** */
19
20 function Line(obj)
21 {
22 this .jg = new jsGraphics(obj);
23 var colors = new Array();
24 colors[ 0 ] = " #0066FF " ;
25 colors[ 1 ] = " #FF6633 " ;
26 colors[ 2 ] = " #9900FF " ;
27 colors[ 3 ] = " #FF0066 " ;
28 colors[ 4 ] = " #066600 " ;
29 colors[ 5 ] = " #006633 " ;
30 colors[ 6 ] = " #33FFFF " ;
31 colors[ 7 ] = " #000000 " ;
32 colors[ 8 ] = " #FFFF00 " ;
33 colors[ 9 ] = " #000033 " ;
34 colors[ 10 ] = " #CCFFFF " ;
35 colors[ 11 ] = " #666666 " ;
36 this .start_x = 40 ; // 應大于等于y_str_width
37 this .y_str_width = 40 ; // 坐標系的左邊距
38 this .x_str_tom = 10 ; // x軸文字 距離坐標系底部距離。
39 this .start_y = 20 ; // >=this.ArrowLength*2 箭頭的高度
40 this .width = 200 ;
41 this .height = 120 ;
42 this .y_line_num = 5 ;
43
44 this .IsDrawArrow = true ;
45 this .ArrowLength = 6 ;
46
47 this .drawXYLine = function (_y,_x)
48 
 {
{
49 var y_length = _y.length;
50 var x_length = _x.length;
51 if (y_length != x_length)
52 {
53 alert( " X and Y length of inconsistencies, errors parameters. " );
54 return ;
55  }
}
56 var y_line_distance = Math.round( this .height / this .y_line_num);
57 var x_line_distance = Math.round( this .width / x_length);
58
59 this .jg.drawLine( this .start_x, this .start_y + this .height, this .start_x + this .width, this .start_y + this .height); // x
60 this .jg.drawLine( this .start_x, this .start_y + this .height, this .start_x, this .start_y); // y
61 this .jg.setStroke(Stroke.DOTTED);
62 var _y_copy = _y.concat();
63 var temp = _y;
64 temp.sort( function AscSort(x, y)
65 {
66 return x == y ? 0 : (x > y ? 1 : - 1 );
67 }
68 );
69 var y_max2y_min = temp[x_length - 1 ] - temp[ 0 ];
70 var y_min = temp[ 0 ];
71 var y_value_distance = y_max2y_min / this .y_line_num;
72 for ( var i = 0 ;i < this .y_line_num;i ++ )
73 {
74 var y_item = this .start_y + this .height - (i + 1 ) * y_line_distance;
75 this .jg.drawLine( this .start_x,y_item, this .start_x + this .width,y_item);
76 var y_v = Math.round(y_value_distance * (i + 1 ) + y_min);
77 this .jg.drawString(y_v, this .start_x - this .y_str_width,y_item);
78 }
79 for (i = 0 ;i < x_length;i ++ )
80 {
81 this .jg.setStroke( - 1 );
82 this .jg.setColor( " #000000 " );
83 var x_item_end = this .start_x + x_line_distance * (i + 1 );
84 this .jg.drawLine(x_item_end, this .start_y + this .height,x_item_end, this .start_y);
85 this .jg.drawString(_x[i],x_item_end, this .start_y + this .height + 10 );
86 }
87 for (i = y_length;i > 1 ;i -- )
88 {
89
90
91 this .jg.setStroke( 2 );
92 this .jg.setColor( " #FF0000 " );
93
94 var x_temp_1 = this .start_x + x_line_distance * (i);
95 var x_temp_2 = this .start_x + x_line_distance * (i - 1 );
96 // alert(_y_copy[i-1]);
97 // alert(y_min);
98 // alert(y_max2y_min);
99 var y_temp_1 = Math.round( this .height - this .height * (_y_copy[i - 1 ] - y_min) / y_max2y_min + this .start_y);
100 var y_temp_2 = Math.round( this .height - this .height * (_y_copy[i - 2 ] - y_min) / y_max2y_min + this .start_y);
101 this .jg.drawLine(x_temp_1,y_temp_1,x_temp_2,y_temp_2);
102 }
103 if ( this .IsDrawArrow)
104 {
105 this .jg.setStroke( 1 );
106 this .jg.setColor( " #000000 " );
107 this .jg.drawLine( this .start_x - this .ArrowLength, this .start_y, this .start_x, this .start_y - 2 * this .ArrowLength);
108 this .jg.drawLine( this .start_x + this .ArrowLength, this .start_y, this .start_x, this .start_y - 2 * this .ArrowLength);
109 this .jg.drawLine( this .start_x, this .start_y, this .start_x, this .start_y - 2 * this .ArrowLength);
110 this .jg.drawLine( this .start_x + this .width, this .start_y + this .height - this .ArrowLength, this .start_x + this .width + 2 * this .ArrowLength, this .start_y + this .height);
111 this .jg.drawLine( this .start_x + this .width, this .start_y + this .height + this .ArrowLength, this .start_x + this .width + 2 * this .ArrowLength, this .start_y + this .height);
112 this .jg.drawLine( this .start_x + this .width, this .start_y + this .height, this .start_x + this .width + 2 * this .ArrowLength, this .start_y + this .height);
113 }
114 this .jg.paint();
115 } ;
116 this .clearLine = function ()
117 {
118 this .jg.clear();
119 } ;
120 }
總結遇到過的一些問題,一數組排序
總結如下:
http://www.tkk7.com/JAVA-HE/archive/2007/07/01/127304.html
二數組排序后怎么取原來沒有排序的數組
eg:
1 < html >
2 < body >
3 < script type ="text/javascript" >
4 function AscSort(x, y) {
5 return x == y ? 0 : (x > y ? 1 : - 1 );
6 }
7 var y = new Array( 36000 , 200 , 500 , 10100 );
8 var te = y;
9 te.sort(AscSort);
10 alert(te);
11 alert(y);
12 </ script >
13 </ body >
14 </ html >
如上程序,我對數組te排序了。但是我又要用到沒有排序的數組y,但是程序的結果是y也排序了。有什么方法嗎?
問題解決:利用concat方法,實現了數組的拷貝。
后記:這種方式的確實現了將數據庫中動態數據以圖表形式顯示在頁面上。程序以javascript實現,利用ajax將實現更好的用戶體驗。這樣做減輕了服務端的壓力。不過,這種方式的確定是客戶端變得龐大。而且其實現原理很恐怖,基本是div實現點陣字原理(一點點畫上去的)來搞的。效率就顯得不夠快。不過我在項目用這中方式也做完一個項目了。呵呵,和原來用jfreechart比較,感覺jfreechart (當然完全可以利用cewolf來簡化操作)不爽的地方是他總是先生成圖。然后利用src來顯示的。其實效率也不怎么高。不過服務器好的話,客戶端就輕松。無非就是胖客戶端和胖服務器的比較,立場都不同了。
程序內部注釋較少,代碼很少。
posted on 2008-07-08 10:43
henry1451 閱讀(835)
評論(2) 編輯 收藏