昨天聽到“數據下探”這個名詞,結果一問才發現是這樣的一回事,就是在圖表上,例如柱狀圖上點擊一個柱子,跳轉到另一個圖表頁面。昨天看了一下JFreeChart,發現可以StandardCategoryURLGenerator類來實現這個功能,昨天做了個簡單的demo,效果還不錯,呵呵,共享一下。
首先建立一個名為barSample的web項目,并將jfreechart1.0.6的相關包加入到其中,本人在該項目中加入的jar包如下:
(1)gnujaxp.jar;
(2)itext-2.0.2.jar;
(3)jcommon-1.0.10.jar;
(4)jfreechart-1.0.6.jar;
(5)jfreechart-1.0.6-experimental.jar;
(6)jfreechart-1.0.6-swt.jar;
(7)servlet.jar;
(8)swtgraphics2d.jar。
并在web.xml中加入相關的配置,配置后的web.xml的內容如下:
 <?xml version="1.0" encoding="UTF-8"?>
<web-app version="2.4"
xmlns="http://java.sun.com/xml/ns/j2ee"
xmlns:xsi="http://www.w3.org/2001/XMLSchema-instance"
xsi:schemaLocation="http://java.sun.com/xml/ns/j2ee
http://java.sun.com/xml/ns/j2ee/web-app_2_4.xsd">
<servlet>
<servlet-name>DisplayChart</servlet-name>
<servlet-class>org.jfree.chart.servlet.DisplayChart</servlet-class>
</servlet>
<servlet-mapping>
<servlet-name>DisplayChart</servlet-name>
<url-pattern>/DisplayChart</url-pattern>
</servlet-mapping>
</web-app>
在WebRoot目錄下建立index.jsp,顯示第一個圖表,該柱狀圖的每根柱子都添加了鏈接,該頁面的代碼如下:
<%@ page contentType="text/html;charset=GBK"%>
<%@ page import="java.awt.Color,
org.jfree.chart.ChartFactory,
org.jfree.chart.JFreeChart,
org.jfree.chart.plot.PlotOrientation,
org.jfree.chart.servlet.ServletUtilities,
org.jfree.data.category.CategoryDataset,
org.jfree.data.general.*,
org.jfree.chart.plot.CategoryPlot,
org.jfree.chart.axis.CategoryAxis,
org.jfree.chart.axis.ValueAxis,
org.jfree.chart.renderer.category.BarRenderer3D,
org.jfree.chart.urls.StandardCategoryURLGenerator,
org.jfree.chart.*,
org.jfree.chart.entity.*,
org.jfree.chart.labels.*"%>
<%
java.io.PrintWriter pw=new java.io.PrintWriter(out);

 double[][] data = new double[][]
  {{672}, {325}, {332}, {440}, {550}, {330}};
String[] rowKeys = {"蘋果", "梨子", "葡萄", "桔子", "西瓜", "香蕉"};
String[] columnKeys = {""};
CategoryDataset dataset = DatasetUtilities.createCategoryDataset(
rowKeys,
columnKeys,
data);
JFreeChart chart = ChartFactory.createBarChart3D("水果銷量圖統計",
"水果",
"銷量",
dataset,
PlotOrientation.VERTICAL,
true,
false,
false);
chart.setBackgroundPaint(Color.WHITE);
CategoryPlot plot = chart.getCategoryPlot();
CategoryAxis domainAxis = plot.getDomainAxis();
plot.setDomainAxis(domainAxis);
ValueAxis rangeAxis = plot.getRangeAxis();
//設置最高的一個 Item 與圖片頂端的距離
rangeAxis.setUpperMargin(0.15);
//設置最低的一個 Item 與圖片底端的距離
rangeAxis.setLowerMargin(0.15);
plot.setRangeAxis(rangeAxis);
BarRenderer3D renderer = new BarRenderer3D();
renderer.setBaseOutlinePaint(Color.BLACK);
//設置 Wall 的顏色
renderer.setWallPaint(Color.gray);
//設置每種水果代表的柱的顏色
renderer.setSeriesPaint(0, new Color(0, 0, 255));
renderer.setSeriesPaint(1, new Color(200, 200, 255));
renderer.setSeriesPaint(2, Color.GREEN);
renderer.setSeriesPaint(3, Color.MAGENTA);
renderer.setSeriesPaint(4, Color.GRAY);
renderer.setSeriesPaint(5, Color.CYAN);
//設置平行柱的之間距離
renderer.setItemMargin(0.3);
//顯示每個柱的數值
renderer.setBaseItemLabelGenerator(new StandardCategoryItemLabelGenerator());
renderer.setBaseItemLabelsVisible(true);
renderer.setBaseItemLabelsVisible(true);
renderer.setBaseItemURLGenerator(new StandardCategoryURLGenerator(
"detail.jsp", "fruit", ""));
plot.setRenderer(renderer);
//設置柱的透明度
plot.setForegroundAlpha(0.5f);
//設置地區、銷量的顯示位置
//plot.setRangeAxisLocation(AxisLocation.BOTTOM_OR_RIGHT);
ChartRenderingInfo info = new ChartRenderingInfo(new
StandardEntityCollection());
String filename = ServletUtilities.saveChartAsPNG(chart, 800, 600, info, session);
String graphURL = request.getContextPath() + "/DisplayChart?filename=" + filename;
ChartUtilities.writeImageMap(pw, filename, info, true);
pw.flush();
%>
<table width="100%">
<tr>
<td align="center">
<img src="<%= graphURL %>" width=800 height=600 border=0 usemap="#<%= filename %>" alt="">
</td>
</tr>
</table>
鏈接到的詳情頁面detail.jsp的內容如下所示:
<%@ page contentType="text/html;charset=GBK"%>
<%@ page import="java.awt.Color,
org.jfree.chart.ChartFactory,
org.jfree.chart.JFreeChart,
org.jfree.chart.plot.PlotOrientation,
org.jfree.chart.servlet.ServletUtilities,
org.jfree.data.category.CategoryDataset,
org.jfree.data.general.*,
org.jfree.chart.plot.CategoryPlot,
org.jfree.chart.axis.CategoryAxis,
org.jfree.chart.axis.ValueAxis,
org.jfree.chart.renderer.category.BarRenderer3D,
org.jfree.chart.labels.*"%>
<%
String fruit = new String(request.getParameter("fruit").getBytes("ISO8859_1"), "utf-8");
int count = 0;
if ("蘋果".equals(fruit)) {
 count = 100;
} else if ("梨子".equals(fruit)) {
count = 26;
} else if ("葡萄".equals(fruit)) {
count = -20;
} else if ("桔子".equals(fruit)) {
count = -40;
} else if ("西瓜".equals(fruit)) {
count = 80;
 }
}
//String address = new String(request.getParameter("address").getBytes("ISO8859_1"), "utf-8");
double[][] data = new double[][] {{672 + count}, {325 + count}, {332 + count}, {440 + count},

 {550 + count}, {330 + count}, {435 + count}, {553 + count},
{335 + count}, {443 + count}, {378 + count}, {733 + count}};
String[] rowKeys = {"一月份", "二月份", "三月份", "四月份",
"五月份", "六月份", "七月份", "八月份",
"九月份", "十月份", "十一月份", "十二月份"};
String[] columnKeys = {""};
CategoryDataset dataset = DatasetUtilities.createCategoryDataset(
rowKeys,
columnKeys,
data);
JFreeChart chart = ChartFactory.createBarChart3D("2007年度" + fruit + "銷量圖",
"月份",
"銷量",
dataset,
PlotOrientation.VERTICAL,
true,
false,
false);
chart.setBackgroundPaint(Color.WHITE);
CategoryPlot plot = chart.getCategoryPlot();
CategoryAxis domainAxis = plot.getDomainAxis();
plot.setDomainAxis(domainAxis);
ValueAxis rangeAxis = plot.getRangeAxis();
//設置最高的一個 Item 與圖片頂端的距離
rangeAxis.setUpperMargin(0.15);
//設置最低的一個 Item 與圖片底端的距離
rangeAxis.setLowerMargin(0.15);
plot.setRangeAxis(rangeAxis);
BarRenderer3D renderer = new BarRenderer3D();
renderer.setBaseOutlinePaint(Color.BLACK);
//設置 Wall 的顏色
renderer.setWallPaint(Color.gray);
//設置每種水果代表的柱的顏色
renderer.setSeriesPaint(0, new Color(0, 0, 255));
renderer.setSeriesPaint(1, new Color(200, 200, 255));
renderer.setSeriesPaint(2, Color.GREEN);
renderer.setSeriesPaint(3, Color.MAGENTA);
renderer.setSeriesPaint(4, Color.GRAY);
renderer.setSeriesPaint(5, Color.CYAN);
//設置平行柱的之間距離
renderer.setItemMargin(0.3);
//顯示每個柱的數值
renderer.setBaseItemLabelGenerator(new StandardCategoryItemLabelGenerator());
renderer.setBaseItemLabelsVisible(true);
plot.setRenderer(renderer);
//設置柱的透明度
plot.setForegroundAlpha(0.5f);
String filename = ServletUtilities.saveChartAsPNG(chart, 800, 550, null, session);
String graphURL = request.getContextPath() + "/DisplayChart?filename=" + filename;
%>
<table width="100%">
<tr>
<td align="center">
<a href="index.jsp">返回</a>
<br>
<img src="<%= graphURL %>" width=800 height=550 border=0 usemap="#<%= filename %>" alt="">
</td>
</tr>
</table>
在Tomcat下部署barSample項目后,輸入地址:
http://localhost:8080/barSample/,運行效果如下圖所示:

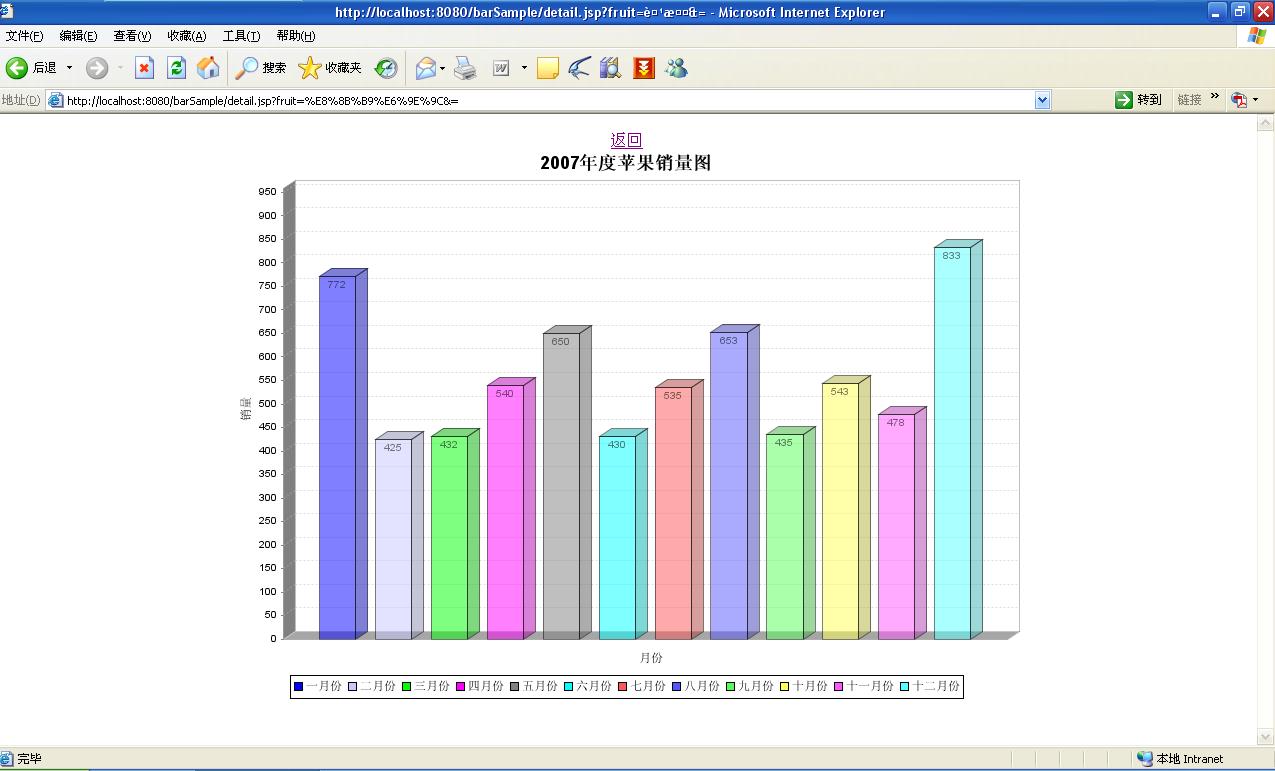
點擊第一個柱子(蘋果所在的柱子)后,鏈接到的頁面如下圖所示:
posted on 2008-02-20 10:34
阿蜜果 閱讀(8352)
評論(12) 編輯 收藏 所屬分類:
JFreeChart