This article will have a simple introduction
on new tool – Eclipse Memory Analyzer (previously called SAP memory analyzer) and how to use this tool to find some interesting memory issues.
1. Install Memory Analyzer into Your Eclipse
- Start the Update Manage via Help → Software Updates…
- Choose the tab Available Software and add the Memory Analyzer Update site: http://download.eclipse.org/technology/mat/0.7/update-site/
- Pick the Memory Analyzer feature. And click “Install” button to install it.
- Accept the license and restart Eclipse
2. Getting a Heap Dump from Sun Virtual Machines
The Memory Analyzer can work with HPROF
binary formatted heap dumps. Those heap dumps are written by Sun
HotSpot and any VM derived from HotSpot. Depending on your scenario,
your OS platform and your JDK version, you have different options to acquire a heap dump.
| Vendor / Release |
-XX:+HeapDumpOnOutOfMemoryError writes heap dump on OutOfMemoryError |
-XX:+HeapDumpOnCtrlBreak writes heap dump together with thread dump on CTRL+BREAK |
Sun JMap: jmap.exe -dump:format=b,file=HeapDump.hprof |
Sun JConsole: Launch jconsole.exe and invoke operation dumpHeap() on HotSpotDiagnostic MBean |
| 1.4.2_12 |
Yes |
Yes |
No |
No |
| 1.5.0_07 |
Yes |
No |
Yes(Only Solaris and Linux) |
No |
| 1.6.0_00 |
Yes |
No |
Yes |
Yes |
Generally, the heap dump file will be generated as java_pid3524.hprof
3. Simplest Way To Find Memory Leaks
- Eclipse Menu Window → Open Perspective → Memory Analyzer
- Eclipse Menu File → Open the Heap Dump => Select the hprof file such as java_pid3524.hprof
- The Overview Diagram will be displayed
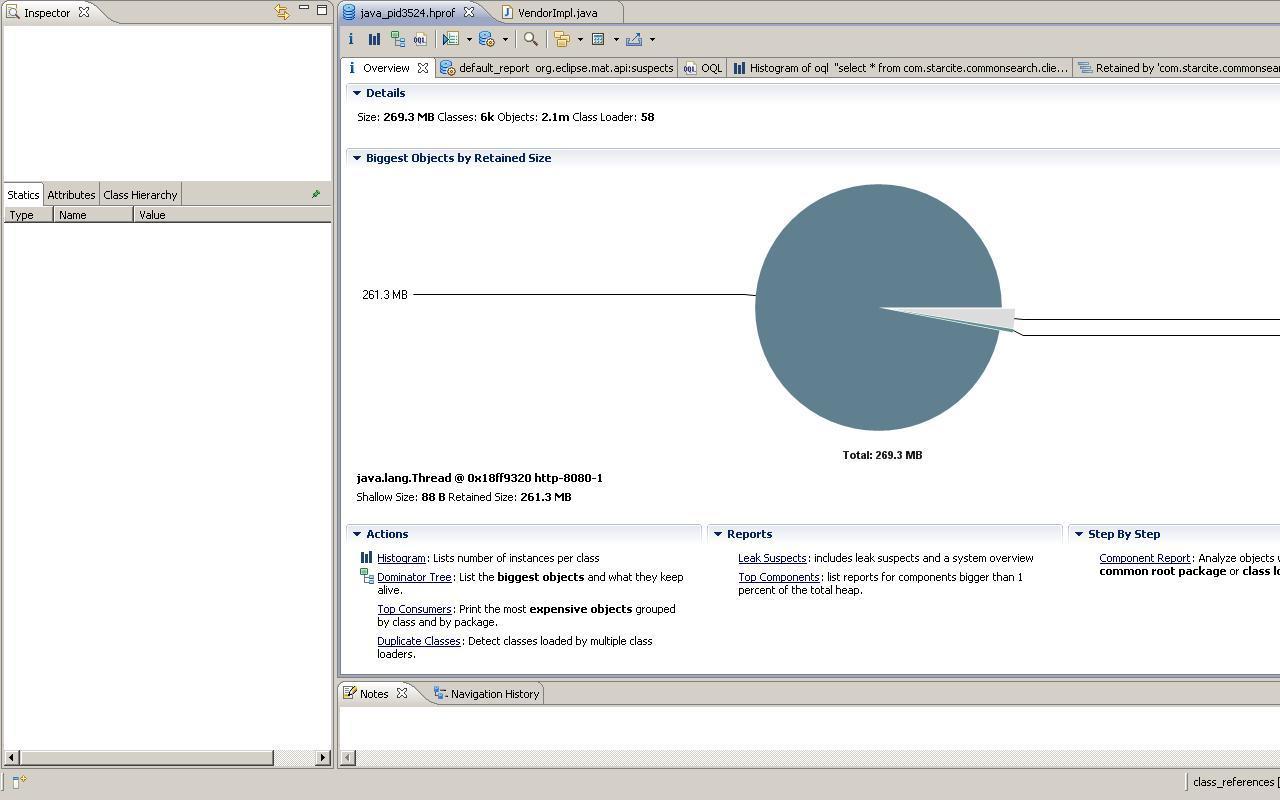
- Click the “Leak Suspects” Report Link
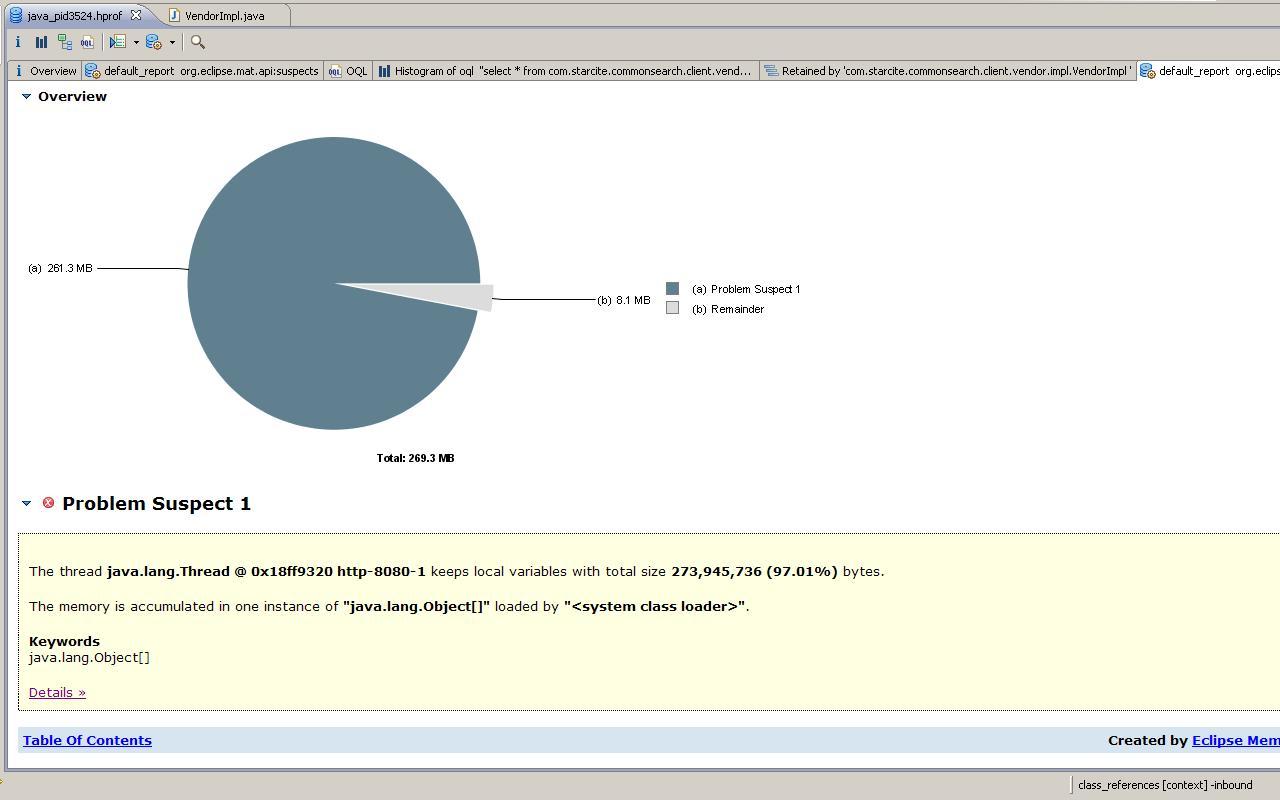
- Click Problem Suspect 1 Details link
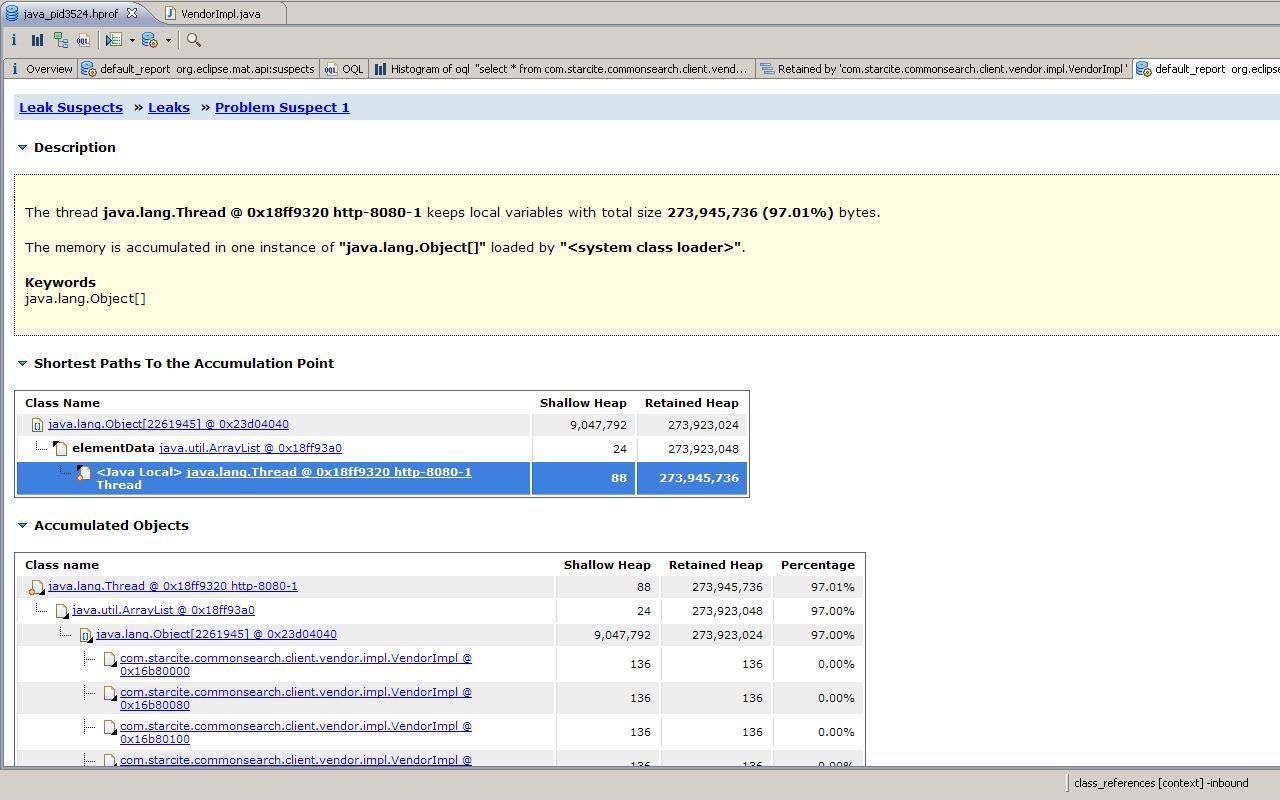
You will see
| Class name |
Shallow Heap |
Retained Heap |
Percentage |
| java.lang.Object2261945 @ 0×23d04040 |
9,047,792 |
273,923,024 |
97.00% |
| com.starcite.commonsearch.client.vendor.impl.VendorImpl @ 0×16b80000 |
135 |
136 |
0.00% |
So, “java.lang.Object2261945
@ 0×23d04040” costs around 9M shallow heap (which means directly
referred memory), and 273 M retained heap (which means all memory
directly or un-directly referred). Now, we can know this is the root
cause of memory leak.
So, what’s next? Of course, next step is trying to find which codes cause this issue?
However, it is not an easy thing. You have to use your experiences now.
Any information we can use it as start point? You can find the following information –
Accumulated Objects
| Class name |
Shallow Heap |
Retained Heap |
Percentage |
| java.lang.Thread @ 0×18ff9320 http-8080-1 |
88 |
273,945,736 |
97.01% |
| java.util.ArrayList @ 0×18ff93a0 |
24 |
273,923,048 |
97.00% |
| java.lang.Object2261945 @ 0×23d04040 |
9,047,792 |
273,923,024 |
97.00% |
| com.starcite.commonsearch.client.vendor.impl.VendorImpl @ 0×16b80000 |
135 |
136 |
0.00% |
From this view, the memory is used by java.lang.Thread @ 0×18ff9320 http-8080-1. So, it should be happened within one HTTP request.
Then, find this thread within Thread Details section. And click Thread Properties link. Please see
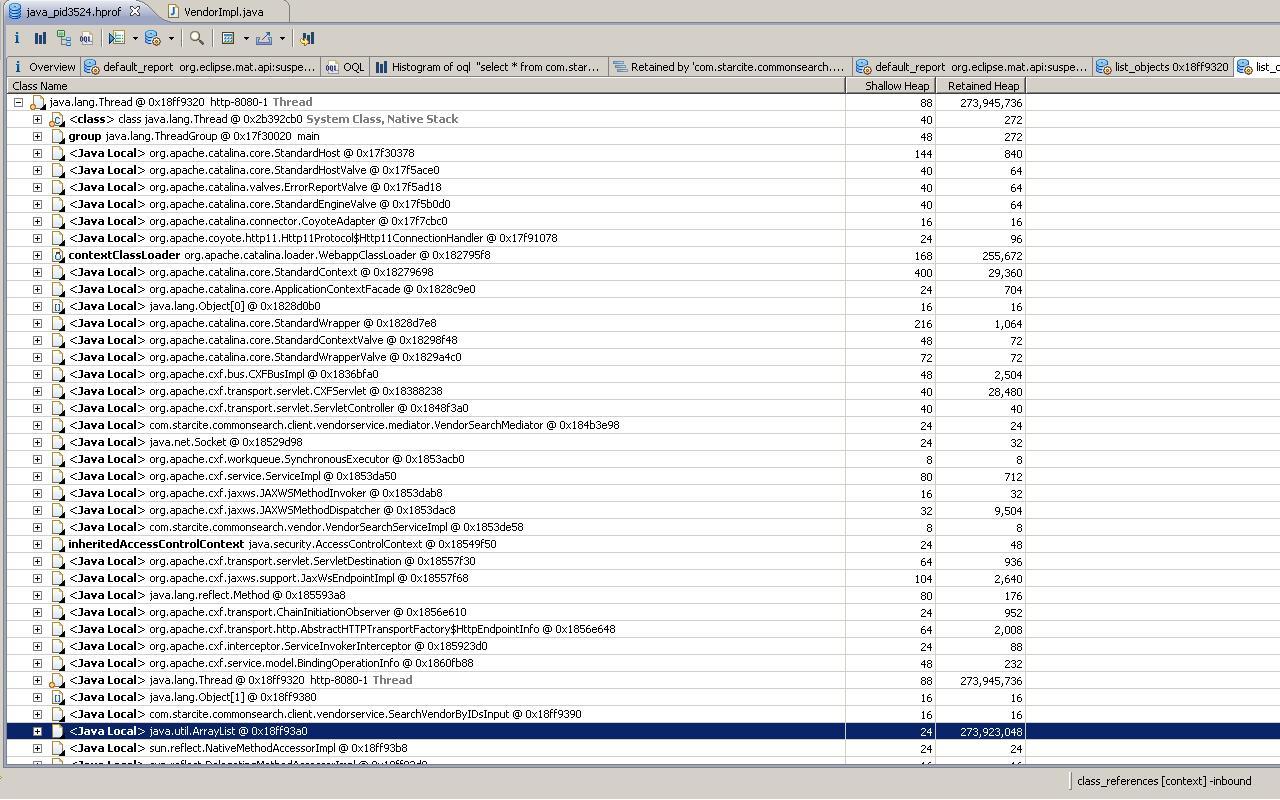
And
now you may find some hints, such as VendorSearchMediator,
SearchVendorByIDsInput etc. Based on these information, you probably
find the root codes –
public SearchVendorByIDsOutput searchVendorByIDs(SearchVendorByIDsInput input) {
List<vendor> vendors = new ArrayList</vendor><vendor>();
for (;;) {
VendorImpl v = new VendorImpl();
v.setName("name");
vendors.add(v);
}
}
</vendor>
4. How to find the memory occupied unused collections – Powerful Object Query Language 1
During
the development, you may never notice that a huge number of collections
which have been instantiated, but have never been used.
An
empty ArrayList, created with the default capacity of 10, costs 80
bytes on a 32 bit system, and 144 bytes on a 64 bit system.
If
the class MyValueStorage is commonly used in our application, and there
are 500.000 instances of it in the heap, then there will be 80Mb on a
32 bit system (on 64 bit – 144MB) reserved for the specialValues and
erroneousValues lists. But only about 5% from them are ever needed.
Therefore, it may be a good idea to use a lazy initialization for these
two fields (keep them null untill they are actually used). The cost we
have to pay is several “if” statements to avoid running into
NullPointerExceptions.
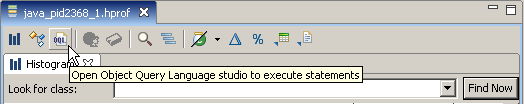
- Open Object Query Language Studio to execute statements
- Check the help pages for a detailed description of the OQL
syntax. For the moment we need only a few concrete queries. For finding
enpty and unmodified ArrayLists, HashMaps and Hashtables they look like
this:
select * from java.util.ArrayList where size=0 and modCount=0
select * from java.util.HashMap where size=0 and modCount=0
select * from java.util.Hashtable where count=0 and modCount=0
- See
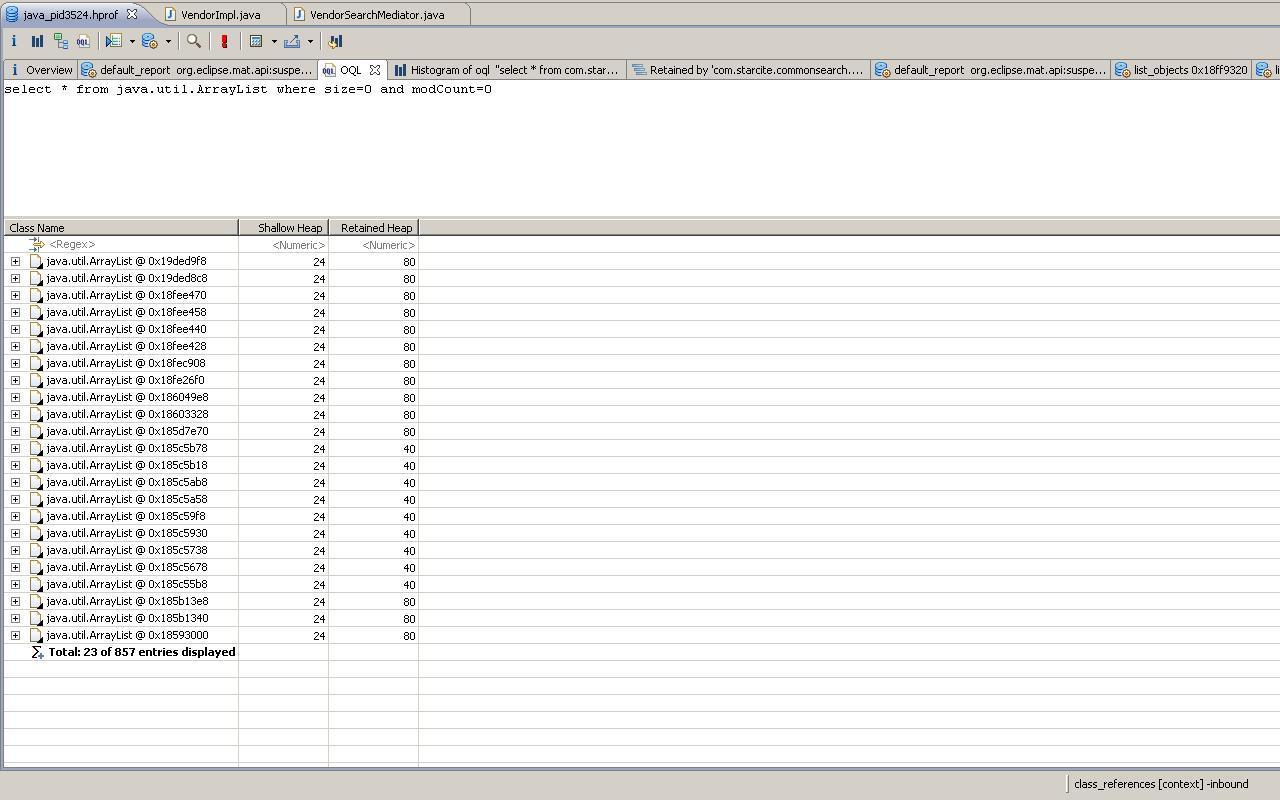 .
Then you can get Retained Heap for each item, such as 80 bytes. And
there are totally 857 entries. So, they doesn’t take too much memory.
.
Then you can get Retained Heap for each item, such as 80 bytes. And
there are totally 857 entries. So, they doesn’t take too much memory.
5. How Many Memory used by VendorImpl – Powerful Object Query Language 2
- Open Object Query Language Studio to execute statements
- Run the following OQL - select * from com.starcite.commonsearch.client.vendor.impl.VendorImpl
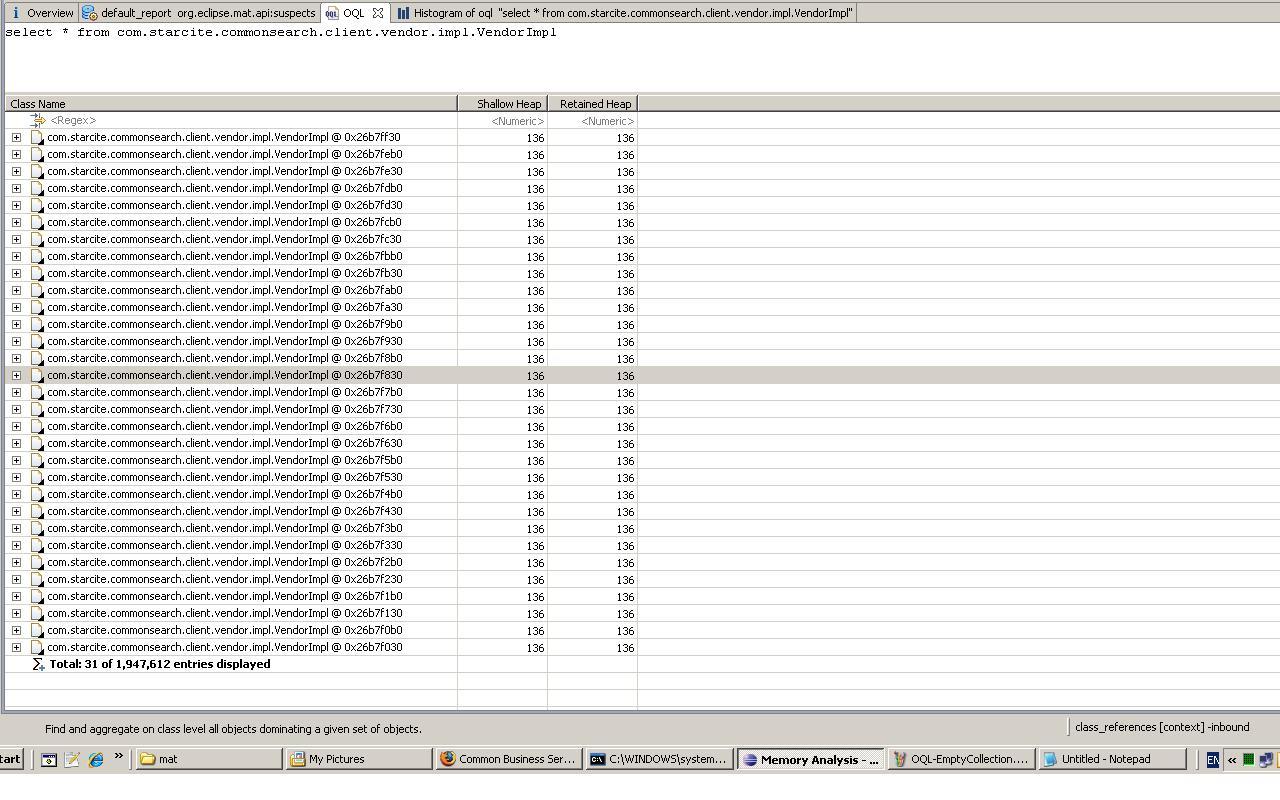
- Click “show s Histogram” – see VendorImpl-Histogram.jpg. And you will find VendorImpl costs more than 260M. That’s very special.
In
summary, Eclipse Memory Analyzer is a very powerful memory analyzer
tool. And it can easier find potential memory leaks. And you can also
find the memory used by any java object.
BTW, there are some related blogs which are very useful.
http://wiki.eclipse.org/index.php/MemoryAnalyzer - the main entry for this tool
http://kohlerm.blogspot.com/ the blog of Markus Kohler, one of the architect of Eclipse Memory Analyzer
https://www.sdn.sap.com/irj/scn/weblogs?blog=/pub/u/1203, the blog of Krum Tsvetkov

posted on 2009-02-22 21:29
Justin Chen 閱讀(5766)
評論(0) 編輯 收藏 所屬分類:
Inside JVM